\n
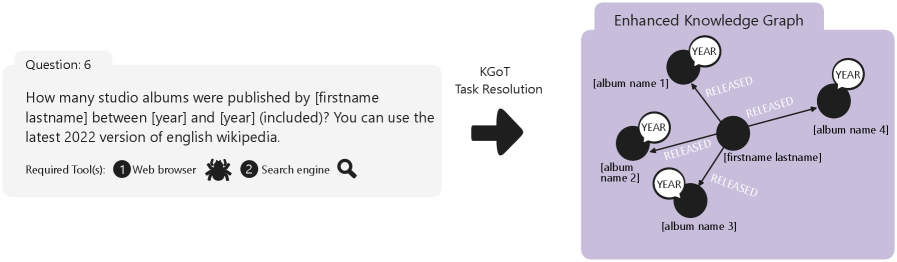
## Diagram: Knowledge Graph Task Resolution
### Overview
The image depicts a diagram illustrating the resolution of a knowledge graph task. The task involves answering the question: "How many studio albums were published by [firstname lastname] between [year] and [year] (included)? You can use the latest 2022 version of English Wikipedia." The diagram shows the transformation from the initial question to an "Enhanced Knowledge Graph" representation.
### Components/Axes
The diagram consists of three main sections:
1. **Question & Tools:** A light-grey box containing the question and the required tools (Web browser and Search engine).
2. **Transformation:** A pair of grey arrows indicating the task resolution process.
3. **Enhanced Knowledge Graph:** A lavender-colored box containing the knowledge graph representation.
The knowledge graph itself consists of nodes and edges:
* **Nodes:** Represent entities like "YEAR", "[album name 1]", "[album name 2]", "[album name 3]", "[album name 4]", and "[firstname lastname]". These are depicted as black circles.
* **Edges:** Represent relationships between entities, labeled "RELEASED". These are depicted as black arrows.
### Detailed Analysis or Content Details
The question section states:
* **Question:** "How many studio albums were published by [firstname lastname] between [year] and [year] (included)? You can use the latest 2022 version of English Wikipedia."
* **Required Tools:**
* Web browser (icon of a globe)
* Search engine (icon of a magnifying glass)
The Enhanced Knowledge Graph shows the following relationships:
* "[album name 1]" is "RELEASED" in "YEAR".
* "[album name 2]" is "RELEASED" in "YEAR".
* "[album name 3]" is "RELEASED" in "YEAR".
* "[album name 4]" is "RELEASED" in "YEAR".
* "[firstname lastname]" is "RELEASED" "[album name 1]", "[album name 2]", "[album name 3]", and "[album name 4]".
The graph structure suggests that the task is resolved by identifying albums released by the specified artist within the given year range. The graph represents the relationships needed to answer the question.
### Key Observations
* The diagram uses bracketed placeholders ([...]) for specific values (artist name, years, album names). This indicates a generalized representation of the task.
* The graph is directed, showing the direction of the "RELEASED" relationship.
* The graph structure is relatively simple, suggesting a straightforward task resolution process.
### Interpretation
The diagram illustrates how a natural language question can be transformed into a structured knowledge graph representation. This representation facilitates the retrieval of information from a knowledge base (like Wikipedia) to answer the question. The graph shows the key entities and relationships needed to determine the number of studio albums published by a given artist within a specified time frame. The use of a knowledge graph allows for a more precise and efficient search compared to simply querying text. The diagram highlights the importance of representing knowledge in a structured format for automated reasoning and question answering. The placeholders suggest that the system is designed to handle various artist names, years, and album titles.