## Diagram: Rotational Dynamics and Magnetic Field Interaction
### Overview
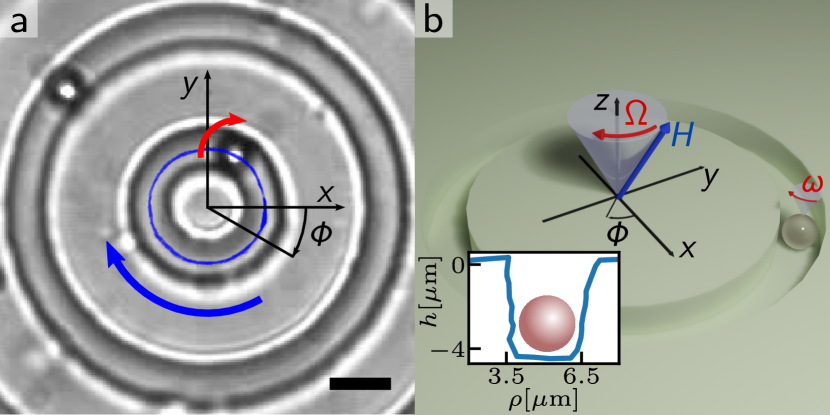
The image consists of two parts:
- **a**: A circular interference pattern with labeled axes (x, y) and angular displacement (φ). Red and blue arrows indicate rotational directions.
- **b**: A 3D schematic of a conical structure with vectors (Ω, H, ω) and an inset graph showing height (h) vs. radial distance (ρ).
### Components/Axes
#### Part a:
- **Axes**:
- x-axis (horizontal) and y-axis (vertical) labeled with standard Cartesian coordinates.
- Angular displacement φ (phi) marked near the origin.
- **Arrows**:
- Red arrow: Clockwise rotation (↔).
- Blue arrow: Counter-clockwise rotation (↔).
- **Scale bar**: 10 µm (bottom-right corner).
#### Part b:
- **3D Diagram**:
- Conical structure with apex labeled Ω (angular velocity, red vector).
- Blue vector H (magnetic field) intersecting the cone.
- Gray vector ω (angular displacement) on the right.
- **Inset Graph**:
- Axes:
- Radial distance ρ (µm) on the x-axis (3.5–6.5 µm).
- Height h (µm) on the y-axis (-4 to 0 µm).
- Blue line: Represents a measured profile with a dip at ρ ≈ 5 µm.
- **Legend**:
- Red: Ω (angular velocity).
- Blue: H (magnetic field).
- Gray: ω (angular displacement).
### Detailed Analysis
#### Part a:
- The circular pattern suggests wave interference or rotational motion.
- Red and blue arrows indicate opposing rotational directions (clockwise vs. counter-clockwise).
- φ (angular displacement) is centered at the origin, with axes x and y defining the plane.
#### Part b:
- **3D Diagram**:
- Ω (red) points upward along the z-axis, indicating rotational motion.
- H (blue) is perpendicular to Ω, suggesting a magnetic field aligned with the y-axis.
- ω (gray) represents angular displacement, oriented tangentially.
- **Inset Graph**:
- The blue line shows a parabolic trend with a minimum at ρ ≈ 5 µm (h ≈ -3 µm).
- Scale bar: 10 µm (bottom-right corner).
### Key Observations
1. **Part a**:
- Opposing rotational directions (red vs. blue arrows) may represent competing forces or wave polarizations.
- The scale bar (10 µm) provides spatial context for the interference pattern.
2. **Part b**:
- The inset graph’s dip at ρ ≈ 5 µm suggests a localized minimum in height, possibly due to resonance or field interaction.
- The 3D vectors (Ω, H, ω) imply a relationship between rotational motion, magnetic fields, and angular displacement.
### Interpretation
- **Part a**: The interference pattern and rotational arrows likely model a system with competing rotational dynamics, such as vortices or polarized waves.
- **Part b**: The 3D diagram and inset graph suggest a physical system where angular velocity (Ω) and magnetic fields (H) interact to produce a measurable height profile (h) as a function of radial distance (ρ). The dip at ρ ≈ 5 µm could indicate a critical interaction point (e.g., magnetic trapping or resonance).
- **Cross-Referencing**: The legend in part b confirms color coding for vectors, ensuring alignment with the 3D model and inset graph.
### Uncertainties
- Approximate values (e.g., ρ ≈ 5 µm, h ≈ -3 µm) are inferred from the inset graph’s scale and trend.
- The exact nature of the rotational motion (e.g., fluid dynamics vs. electromagnetic) is not explicitly stated.