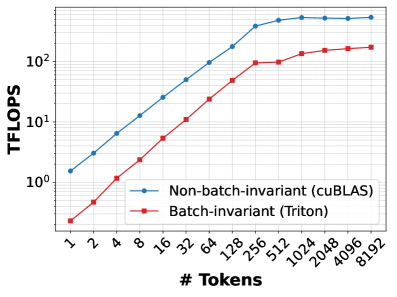
## Log-Log Chart: Performance Comparison of cuBLAS and Triton
### Overview
The image is a log-log chart comparing the performance of two linear algebra libraries, cuBLAS and Triton, in terms of TFLOPS (Tera Floating Point Operations Per Second) as a function of the number of tokens. The x-axis represents the number of tokens, ranging from 1 to 8192, and the y-axis represents the TFLOPS, ranging from 10^0 to 10^2. The chart compares "Non-batch-invariant (cuBLAS)" and "Batch-invariant (Triton)".
### Components/Axes
* **X-axis:** "# Tokens" - logarithmic scale with values: 1, 2, 4, 8, 16, 32, 64, 128, 256, 512, 1024, 2048, 4096, 8192.
* **Y-axis:** "TFLOPS" - logarithmic scale with values: 10^0 (1), 10^1 (10), 10^2 (100).
* **Legend:** Located in the bottom-right of the chart.
* Blue line with circle markers: "Non-batch-invariant (cuBLAS)"
* Red line with square markers: "Batch-invariant (Triton)"
### Detailed Analysis
* **Non-batch-invariant (cuBLAS) - Blue Line:**
* Trend: The line generally slopes upward, indicating increasing TFLOPS with an increasing number of tokens. The slope decreases as the number of tokens increases, suggesting diminishing returns.
* Data Points:
* 1 Token: ~1.5 TFLOPS
* 2 Tokens: ~3 TFLOPS
* 4 Tokens: ~5 TFLOPS
* 8 Tokens: ~8 TFLOPS
* 16 Tokens: ~14 TFLOPS
* 32 Tokens: ~25 TFLOPS
* 64 Tokens: ~45 TFLOPS
* 128 Tokens: ~75 TFLOPS
* 256 Tokens: ~110 TFLOPS
* 512 Tokens: ~140 TFLOPS
* 1024 Tokens: ~150 TFLOPS
* 2048 Tokens: ~155 TFLOPS
* 4096 Tokens: ~160 TFLOPS
* 8192 Tokens: ~160 TFLOPS
* **Batch-invariant (Triton) - Red Line:**
* Trend: The line generally slopes upward, indicating increasing TFLOPS with an increasing number of tokens. The slope decreases as the number of tokens increases, suggesting diminishing returns. The Triton line plateaus earlier than the cuBLAS line.
* Data Points:
* 1 Token: ~0.3 TFLOPS
* 2 Tokens: ~0.6 TFLOPS
* 4 Tokens: ~1.2 TFLOPS
* 8 Tokens: ~2.5 TFLOPS
* 16 Tokens: ~5 TFLOPS
* 32 Tokens: ~10 TFLOPS
* 64 Tokens: ~20 TFLOPS
* 128 Tokens: ~40 TFLOPS
* 256 Tokens: ~85 TFLOPS
* 512 Tokens: ~95 TFLOPS
* 1024 Tokens: ~100 TFLOPS
* 2048 Tokens: ~105 TFLOPS
* 4096 Tokens: ~110 TFLOPS
* 8192 Tokens: ~110 TFLOPS
### Key Observations
* For a small number of tokens (1-64), cuBLAS outperforms Triton.
* Both cuBLAS and Triton show performance improvements with an increasing number of tokens, but the rate of improvement decreases as the number of tokens increases.
* cuBLAS consistently outperforms Triton across all token counts.
* Both lines plateau at higher token counts, indicating a limit to performance gains.
### Interpretation
The chart demonstrates the performance scaling of cuBLAS and Triton with respect to the number of tokens. cuBLAS, being non-batch-invariant, generally achieves higher TFLOPS compared to Triton, which is batch-invariant. The diminishing returns observed at higher token counts suggest that other factors, such as memory bandwidth or computational bottlenecks, become limiting factors. The data suggests that cuBLAS is more efficient for this particular workload across the tested range of token counts. The plateauing of performance indicates that simply increasing the number of tokens will not indefinitely improve performance, and other optimization strategies may be necessary.