## Line Chart: Performance Comparison (TFLOPS) vs. # Tokens
### Overview
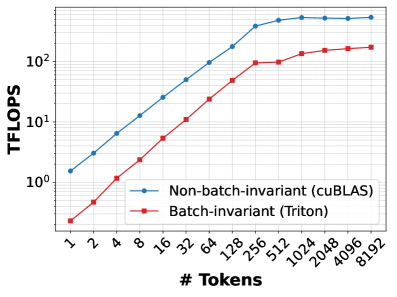
This image is a log-log line chart comparing the computational performance (measured in TFLOPS) of two different software implementations—"Non-batch-invariant (cuBLAS)" and "Batch-invariant (Triton)"—across a range of token counts (# Tokens). The chart illustrates how performance scales as the number of tokens increases, highlighting the performance gap and saturation points for both methods.
### Components/Axes
* **Y-Axis:** Labeled "TFLOPS". This is a logarithmic scale representing computational throughput.
* **X-Axis:** Labeled "# Tokens". This is a logarithmic scale representing the input size. The values are: 1, 2, 4, 8, 16, 32, 64, 128, 256, 512, 1024, 2048, 4096, 8192.
* **Legend:** Positioned in the bottom-center of the chart area.
* **Blue line with circle markers:** "Non-batch-invariant (cuBLAS)"
* **Red line with square markers:** "Batch-invariant (Triton)"
### Detailed Analysis
**Trend Verification:**
Both data series exhibit a strong positive correlation (upward slope) as the number of tokens increases from 1 to approximately 256-512. Following this growth phase, both lines enter a saturation phase where performance levels off, indicating that the system has reached a hardware or memory bandwidth limit.
**Data Point Extraction (Approximate Values):**
| # Tokens | Non-batch-invariant (cuBLAS) [Blue] | Batch-invariant (Triton) [Red] |
| :--- | :--- | :--- |
| 1 | ~1.5 TFLOPS | ~0.25 TFLOPS |
| 2 | ~3 TFLOPS | ~0.5 TFLOPS |
| 4 | ~6 TFLOPS | ~1.1 TFLOPS |
| 8 | ~12 TFLOPS | ~2.2 TFLOPS |
| 16 | ~25 TFLOPS | ~5 TFLOPS |
| 32 | ~50 TFLOPS | ~10 TFLOPS |
| 64 | ~95 TFLOPS | ~22 TFLOPS |
| 128 | ~180 TFLOPS | ~45 TFLOPS |
| 256 | ~380 TFLOPS | ~90 TFLOPS |
| 512 | ~500 TFLOPS | ~95 TFLOPS |
| 1024 | ~580 TFLOPS | ~130 TFLOPS |
| 2048 | ~580 TFLOPS | ~150 TFLOPS |
| 4096 | ~580 TFLOPS | ~160 TFLOPS |
| 8192 | ~600 TFLOPS | ~170 TFLOPS |
### Key Observations
* **Performance Gap:** The "Non-batch-invariant (cuBLAS)" implementation consistently outperforms the "Batch-invariant (Triton)" implementation by a significant margin, often by a factor of 3x to 5x across the measured range.
* **Saturation Points:**
* The **Blue line (cuBLAS)** reaches its primary saturation point around 512 tokens, after which performance gains are marginal.
* The **Red line (Triton)** reaches a temporary plateau around 256-512 tokens, but continues to show slight performance growth up to 2048 tokens before flattening out.
* **Scaling:** Both implementations scale linearly (in log-log space) until they hit their respective hardware/implementation limits.
### Interpretation
This chart demonstrates a classic engineering trade-off between **specialized optimization** and **generalization**.
* **Non-batch-invariant (cuBLAS):** The high performance suggests this implementation is highly optimized for specific, fixed-size operations. It likely utilizes highly tuned kernels (cuBLAS) that are not designed to handle varying batch sizes dynamically, hence the "non-batch-invariant" label. It hits the hardware ceiling faster because it is likely more efficient at utilizing the GPU's compute units for those specific configurations.
* **Batch-invariant (Triton):** The lower performance suggests that this implementation prioritizes flexibility. Being "batch-invariant" implies the code can handle varying input sizes without needing to recompile or switch kernels. This flexibility comes at the cost of raw peak performance (TFLOPS), as the kernel must be more generalized and potentially less efficient than the highly specialized cuBLAS kernels.
* **Conclusion:** If the application requires maximum throughput and the batch size is static, cuBLAS is the clear choice. If the application requires dynamic batching or variable token lengths, Triton is the necessary choice, despite the performance penalty.