## Line Chart: TFLOPS vs. Number of Tokens
### Overview
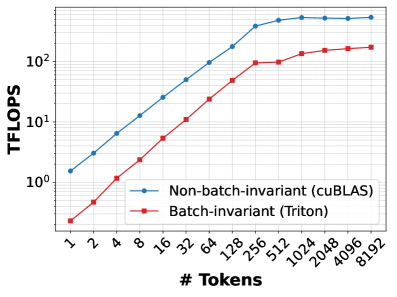
This image presents a line chart comparing the performance (measured in TFLOPS - Tera Floating Point Operations Per Second) of two implementations – Non-batch-invariant (using cuBLAS) and Batch-invariant (using Triton) – as the number of tokens increases. The chart visually demonstrates how performance scales with increasing input size for each implementation.
### Components/Axes
* **X-axis:** "# Tokens" - Represents the number of tokens, with markers at 1, 2, 4, 8, 16, 32, 64, 128, 256, 512, 1024, 2048, 4096, and 8192.
* **Y-axis:** "TFLOPS" - Represents the performance in Tera Floating Point Operations Per Second. The scale is logarithmic, ranging from 10⁰ to approximately 10² (1 to 100).
* **Legend:** Located in the top-right corner.
* Blue Line: "Non-batch-invariant (cuBLAS)" - Represented by blue markers with lines.
* Red Line: "Batch-invariant (Triton)" - Represented by red markers with lines.
* **Gridlines:** A light gray grid is present to aid in reading values.
### Detailed Analysis
**Non-batch-invariant (cuBLAS) - Blue Line:**
The blue line shows an upward trend, indicating increasing TFLOPS as the number of tokens increases. The slope of the line decreases as the number of tokens grows, suggesting diminishing returns in performance gains.
* 1 Token: Approximately 1.5 TFLOPS
* 2 Tokens: Approximately 2.5 TFLOPS
* 4 Tokens: Approximately 4.5 TFLOPS
* 8 Tokens: Approximately 8.5 TFLOPS
* 16 Tokens: Approximately 16 TFLOPS
* 32 Tokens: Approximately 30 TFLOPS
* 64 Tokens: Approximately 55 TFLOPS
* 128 Tokens: Approximately 95 TFLOPS
* 256 Tokens: Approximately 150 TFLOPS
* 512 Tokens: Approximately 210 TFLOPS
* 1024 Tokens: Approximately 260 TFLOPS
* 2048 Tokens: Approximately 290 TFLOPS
* 4096 Tokens: Approximately 300 TFLOPS
* 8192 Tokens: Approximately 305 TFLOPS
**Batch-invariant (Triton) - Red Line:**
The red line also shows an upward trend, but it is less steep than the blue line, especially at lower token counts. The slope of the red line also decreases, but it appears to level off more quickly than the blue line.
* 1 Token: Approximately 0.5 TFLOPS
* 2 Tokens: Approximately 1.5 TFLOPS
* 4 Tokens: Approximately 3.5 TFLOPS
* 8 Tokens: Approximately 7.5 TFLOPS
* 16 Tokens: Approximately 15 TFLOPS
* 32 Tokens: Approximately 25 TFLOPS
* 64 Tokens: Approximately 45 TFLOPS
* 128 Tokens: Approximately 70 TFLOPS
* 256 Tokens: Approximately 95 TFLOPS
* 512 Tokens: Approximately 110 TFLOPS
* 1024 Tokens: Approximately 125 TFLOPS
* 2048 Tokens: Approximately 135 TFLOPS
* 4096 Tokens: Approximately 140 TFLOPS
* 8192 Tokens: Approximately 145 TFLOPS
### Key Observations
* The cuBLAS implementation (blue line) consistently outperforms the Triton implementation (red line) across all token counts, but the difference diminishes as the number of tokens increases.
* Both implementations exhibit diminishing returns in performance gains as the number of tokens grows.
* The Triton implementation shows a more gradual performance increase, leveling off at higher token counts.
* The logarithmic scale of the Y-axis emphasizes the relative performance differences.
### Interpretation
The chart demonstrates the performance characteristics of two different implementations for processing tokens. The cuBLAS implementation, being non-batch-invariant, appears to be more efficient for smaller batch sizes (lower token counts). However, as the batch size increases, the performance gap between the two implementations narrows. This suggests that the Triton implementation, being batch-invariant, is better suited for larger batch sizes, as it can leverage batch processing to improve performance. The leveling off of the Triton line indicates that it reaches a performance ceiling, likely due to limitations in its batch processing capabilities or other architectural constraints. The diminishing returns observed in both implementations suggest that there are inherent limitations in the underlying hardware or algorithms that prevent further performance scaling with increasing token counts. This data is valuable for choosing the appropriate implementation based on the expected batch size and performance requirements.