## Line Chart: Performance (TFLOPS) vs. Number of Tokens
### Overview
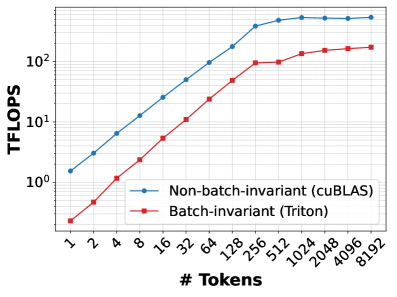
The image is a line chart comparing the computational performance, measured in Tera Floating-Point Operations Per Second (TFLOPS), of two different methods as a function of the number of tokens processed. The chart uses a logarithmic scale for both the Y-axis (TFLOPS) and the X-axis (# Tokens).
### Components/Axes
* **Chart Type:** Line chart with markers.
* **Y-Axis:**
* **Label:** `TFLOPS`
* **Scale:** Logarithmic (base 10).
* **Major Ticks/Labels:** `10^0` (1), `10^1` (10), `10^2` (100).
* **X-Axis:**
* **Label:** `# Tokens`
* **Scale:** Logarithmic (base 2).
* **Major Ticks/Labels:** `1`, `2`, `4`, `8`, `16`, `32`, `64`, `128`, `256`, `512`, `1024`, `2048`, `4096`, `8192`.
* **Legend:**
* **Position:** Bottom-right corner of the plot area.
* **Series 1:** `Non-batch-invariant (cuBLAS)` - Represented by a blue line with circular markers.
* **Series 2:** `Batch-invariant (Triton)` - Represented by a red line with square markers.
### Detailed Analysis
**Trend Verification:**
* **Blue Line (Non-batch-invariant):** Shows a steep, roughly linear increase on the log-log plot from 1 token up to approximately 256 tokens, after which the slope decreases and the line plateaus.
* **Red Line (Batch-invariant):** Follows a similar upward trend but is consistently positioned below the blue line. It also shows a steep increase up to ~256 tokens before beginning to plateau.
**Data Point Extraction (Approximate Values):**
The following table reconstructs the approximate data points based on visual inspection of the chart. Values are estimates due to the logarithmic scale.
| # Tokens | Non-batch-invariant (cuBLAS) [TFLOPS] | Batch-invariant (Triton) [TFLOPS] |
| :--- | :--- | :--- |
| 1 | ~1.5 | ~0.2 |
| 2 | ~3 | ~0.5 |
| 4 | ~6 | ~1.2 |
| 8 | ~12 | ~2.5 |
| 16 | ~25 | ~5 |
| 32 | ~50 | ~10 |
| 64 | ~100 | ~20 |
| 128 | ~150 | ~40 |
| 256 | ~200 | ~90 |
| 512 | ~220 | ~100 |
| 1024 | ~230 | ~120 |
| 2048 | ~230 | ~130 |
| 4096 | ~230 | ~140 |
| 8192 | ~230 | ~140 |
### Key Observations
1. **Performance Hierarchy:** The `Non-batch-invariant (cuBLAS)` method consistently achieves higher TFLOPS than the `Batch-invariant (Triton)` method across all measured token counts.
2. **Scaling Behavior:** Both methods exhibit strong performance scaling with increasing token count up to a point (around 256-512 tokens). This suggests that larger batch sizes or sequence lengths allow for better hardware utilization.
3. **Saturation Point:** Both curves begin to plateau after approximately 512 tokens. The `cuBLAS` method plateaus at a higher absolute performance level (~230 TFLOPS) compared to the `Triton` method (~140 TFLOPS).
4. **Relative Gap:** The performance gap between the two methods is largest at very small token counts (e.g., at 1 token, cuBLAS is ~7.5x faster) and narrows as the token count increases, though it remains significant (at 8192 tokens, cuBLAS is ~1.6x faster).
### Interpretation
This chart demonstrates a performance benchmark likely related to matrix multiplication or similar tensor operations fundamental to machine learning models, comparing a standard library implementation (cuBLAS) against a custom kernel (Triton).
* **What the data suggests:** The `Non-batch-invariant` (cuBLAS) implementation is highly optimized for raw throughput, especially when the operation can leverage large, batched computations. The `Batch-invariant` (Triton) implementation, while potentially offering other benefits like numerical consistency or flexibility, incurs a performance cost.
* **Relationship between elements:** The X-axis (# Tokens) is a proxy for problem size. The chart shows that both implementations benefit from larger problem sizes up to a hardware or algorithmic limit (the plateau). The persistent gap indicates that the cuBLAS routine has a more efficient underlying implementation for this specific operation.
* **Notable implications:** The choice between these methods involves a trade-off. If maximum speed is the priority and the operation can tolerate batch-invariance, cuBLAS is superior. If batch-invariance is a strict requirement (e.g., for certain types of model parallelism or deterministic training), one must accept the lower throughput of the Triton kernel. The plateau suggests that beyond ~512 tokens, increasing the batch size further does not yield better performance, indicating a potential bottleneck elsewhere in the system (e.g., memory bandwidth).