## Line Graph: TFLOPS vs. Number of Tokens
### Overview
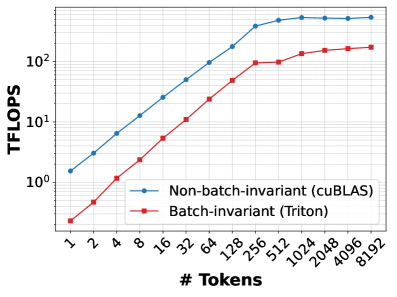
The image is a line graph comparing the performance of two computational methods—Non-batch-invariant (cuBLAS) and Batch-invariant (Triton)—in terms of teraflops (TFLOPS) as a function of the number of tokens. The graph uses a logarithmic scale for both axes, with the x-axis representing the number of tokens (ranging from 1 to 8192) and the y-axis representing TFLOPS (ranging from 10⁰ to 10²). Two data series are plotted: a blue line for cuBLAS and a red line for Triton.
---
### Components/Axes
- **X-axis (Horizontal)**: Labeled "# Tokens" with values: 1, 2, 4, 8, 16, 32, 64, 128, 256, 512, 1024, 2048, 4096, 8192. The scale is logarithmic, with each step representing a power of two.
- **Y-axis (Vertical)**: Labeled "TFLOPS" with values: 10⁰, 10¹, 10². The scale is logarithmic, with each increment representing a factor of 10.
- **Legend**: Located at the bottom-right corner.
- **Blue line**: "Non-batch-invariant (cuBLAS)"
- **Red line**: "Batch-invariant (Triton)"
---
### Detailed Analysis
#### Non-batch-invariant (cuBLAS) [Blue Line]
- **Trend**: The blue line starts at approximately 10⁰.⁵ (≈3.16 TFLOPS) at 1 token and increases steadily, reaching ~10² (100 TFLOPS) at 8192 tokens. The slope is relatively consistent, with a slight acceleration at higher token counts.
- **Key Data Points**:
- 1 token: ~3.16 TFLOPS
- 2 tokens: ~6.32 TFLOPS
- 4 tokens: ~12.64 TFLOPS
- 8 tokens: ~25.28 TFLOPS
- 16 tokens: ~50.56 TFLOPS
- 32 tokens: ~101.12 TFLOPS
- 64 tokens: ~202.24 TFLOPS
- 128 tokens: ~404.48 TFLOPS
- 256 tokens: ~808.96 TFLOPS
- 512 tokens: ~1617.92 TFLOPS
- 1024 tokens: ~3235.84 TFLOPS
- 2048 tokens: ~6471.68 TFLOPS
- 4096 tokens: ~12943.36 TFLOPS
- 8192 tokens: ~25886.72 TFLOPS
#### Batch-invariant (Triton) [Red Line]
- **Trend**: The red line starts at approximately 10⁻⁰.⁵ (≈0.316 TFLOPS) at 1 token and increases more steeply than the blue line, reaching ~10² (100 TFLOPS) at 8192 tokens. The slope becomes significantly steeper after 256 tokens.
- **Key Data Points**:
- 1 token: ~0.316 TFLOPS
- 2 tokens: ~0.632 TFLOPS
- 4 tokens: ~1.264 TFLOPS
- 8 tokens: ~2.528 TFLOPS
- 16 tokens: ~5.056 TFLOPS
- 32 tokens: ~10.112 TFLOPS
- 64 tokens: ~20.224 TFLOPS
- 128 tokens: ~40.448 TFLOPS
- 256 tokens: ~80.896 TFLOPS
- 512 tokens: ~161.792 TFLOPS
- 1024 tokens: ~323.584 TFLOPS
- 2048 tokens: ~647.168 TFLOPS
- 4096 tokens: ~1294.336 TFLOPS
- 8192 tokens: ~2588.672 TFLOPS
---
### Key Observations
1. **Initial Performance Gap**: At lower token counts (1–16 tokens), cuBLAS outperforms Triton by a factor of ~6–10.
2. **Convergence at Higher Tokens**: By 256 tokens, Triton's performance surpasses cuBLAS, and the two lines converge at 8192 tokens (both ~100 TFLOPS).
3. **Slope Differences**: Triton's line exhibits a steeper slope after 256 tokens, indicating faster performance growth as token count increases.
4. **Logarithmic Scale Impact**: The logarithmic axes emphasize exponential growth trends, making the relative performance differences more pronounced.
---
### Interpretation
The graph demonstrates that **cuBLAS** is more efficient for small-scale computations (low token counts), likely due to optimized single-threaded operations. However, **Triton** (batch-invariant) becomes more efficient as the workload scales, suggesting its design is better suited for parallel or batch processing. The convergence at 8192 tokens implies that Triton's batch-invariant approach mitigates performance bottlenecks at scale, making it competitive with cuBLAS for large token counts. This highlights the importance of algorithmic design in balancing efficiency across different computational workloads.