## Diagram: Causal Inference vs. Learning Agent
### Overview
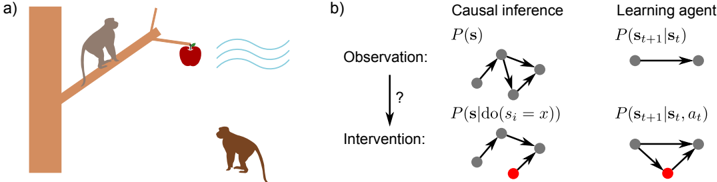
The image presents two scenarios, labeled 'a' and 'b'. Scenario 'a' depicts a monkey observing an apple on a tree branch, with another monkey on the ground. Scenario 'b' contrasts causal inference and learning agent models using directed graphs to represent probabilities and interventions.
### Components/Axes
**Part a):**
* **Setting:** A tree with a branch.
* **Objects:** Two monkeys (one on the branch, one on the ground), an apple on the branch, and wavy lines suggesting wind.
**Part b):**
* **Titles:** "Causal inference" and "Learning agent".
* **Probabilities:** P(s), P(s | do(sᵢ = x)), P(sₜ₊₁ | sₜ), P(sₜ₊₁ | sₜ, aₜ).
* **Labels:** "Observation:" and "Intervention:".
* **Graphs:** Directed graphs with nodes (gray circles) and edges (arrows). One node is colored red in each of the "Intervention" graphs.
### Detailed Analysis
**Part a):**
* A monkey is sitting on a tree branch, looking at a red apple.
* Another monkey is on the ground, looking towards the tree.
* Wavy lines suggest wind or movement in the air.
**Part b):**
* **Causal Inference:**
* **Observation:** A directed graph with 5 gray nodes and multiple arrows indicating causal relationships.
* Probability: P(s)
* **Intervention:** A directed graph with 4 gray nodes and one red node. Arrows indicate causal relationships.
* Probability: P(s | do(sᵢ = x))
* **Learning Agent:**
* **Observation:** A directed graph with two gray nodes and a single arrow.
* Probability: P(sₜ₊₁ | sₜ)
* **Intervention:** A directed graph with three gray nodes and one red node. Arrows indicate relationships.
* Probability: P(sₜ₊₁ | sₜ, aₜ)
* **Flow:** An arrow labeled with a question mark connects "Observation:" to "Intervention:".
### Key Observations
* Part a) illustrates a real-world scenario of observation and potential action.
* Part b) uses directed graphs to model causal inference and learning agents, contrasting observational and interventional probabilities.
* The red node in each "Intervention" graph likely represents an intervened variable.
### Interpretation
The image contrasts how causal inference and learning agents handle observations and interventions. Part a) sets the stage with a simple scenario. Part b) then formalizes these concepts using probabilistic graphical models. The "Causal inference" section shows how interventions (represented by the red node) alter the causal structure. The "Learning agent" section shows how the agent's actions (aₜ) influence the transition between states (sₜ and sₜ₊₁). The question mark between "Observation" and "Intervention" suggests the need to infer causal relationships from observations before planning interventions.