## Diagram: Causal Inference and Learning Agent Framework
### Overview
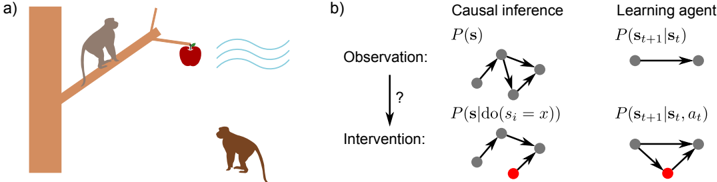
The image combines a narrative scenario (a monkey on a tree branch with an apple) and formal diagrams representing causal inference and learning agent dynamics. The left side (a) depicts a physical interaction, while the right side (b) abstracts this into probabilistic and decision-theoretic models.
### Components/Axes
#### Part a) Narrative Scenario
- **Labels**:
- "a)" (top-left corner).
- "Observation:" (arrow pointing to a question mark).
- "Intervention:" (arrow pointing downward).
- **Elements**:
- Tree with a branch.
- Monkey on the branch holding an apple.
- Second monkey below the branch.
- Wavy lines (possibly representing wind or environmental factors).
#### Part b) Causal Inference and Learning Agent
- **Causal Inference Section**:
- **Labels**:
- "Causal inference" (top-left).
- "P(s)" (probability of state *s*).
- "P(s|do(s_i = x))" (interventional probability).
- **Diagram**:
- Nodes connected by arrows (directed graph).
- Red dot on one node (likely an intervention point).
- **Learning Agent Section**:
- **Labels**:
- "Learning agent" (top-right).
- "P(s_{t+1}|s_t)" (state transition probability).
- "P(s_{t+1}|s_t, a_t)" (state transition with action *a_t*).
- **Diagram**:
- Nodes connected by arrows (directed graph).
- Red dot on one node (action/intervention).
### Detailed Analysis
#### Part a)
- The monkey on the branch (agent) observes the apple (goal) and the environment (wavy lines).
- The second monkey below suggests a potential intervention (e.g., another agent or external force).
- The question mark and arrow imply uncertainty in the outcome of the observation.
#### Part b)
1. **Causal Inference**:
- The graph represents a probabilistic model where states (*s*) influence each other.
- The intervention "do(s_i = x)" modifies the causal structure, isolating the effect of variable *s_i*.
- The red dot likely marks the intervened node.
2. **Learning Agent**:
- The agent models transitions between states (*s_t* → *s_{t+1}*) with and without actions (*a_t*).
- The red dot in this diagram may represent an action taken by the agent.
### Key Observations
- The narrative (a) and formal models (b) are linked: the monkey’s observation/intervention maps to the causal/learning framework.
- The red dots in both diagrams highlight critical intervention points.
- The learning agent’s model explicitly incorporates actions (*a_t*), unlike the causal inference model, which focuses on state transitions.
### Interpretation
- **Causal Inference**: Demonstrates how interventions (e.g., setting *s_i = x*) allow for counterfactual reasoning, separating correlation from causation.
- **Learning Agent**: Shows how actions (*a_t*) influence state transitions, enabling goal-directed behavior.
- **Integration**: The diagram bridges real-world scenarios (monkey and apple) with abstract models, illustrating how observations lead to interventions and how agents learn from actions.
- **Notable Pattern**: The red dots in both diagrams emphasize the role of deliberate interventions in shaping outcomes, whether in physical systems or probabilistic models.