## Line Graph: Accuracy vs. Rejection Threshold
### Overview
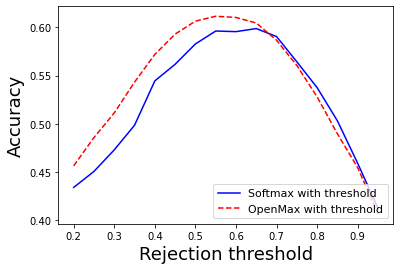
The image is a line graph comparing the accuracy of two methods—**Softmax with threshold** (solid blue line) and **OpenMax with threshold** (dashed red line)—across varying rejection thresholds. The x-axis represents the rejection threshold (ranging from 0.2 to 0.9), and the y-axis represents accuracy (ranging from 0.40 to 0.60). Both lines exhibit a bell-shaped curve, peaking at different thresholds and accuracy levels.
---
### Components/Axes
- **X-axis (Rejection threshold)**: Labeled "Rejection threshold," with markers at 0.2, 0.3, 0.4, 0.5, 0.6, 0.7, 0.8, and 0.9.
- **Y-axis (Accuracy)**: Labeled "Accuracy," with markers at 0.40, 0.45, 0.50, 0.55, and 0.60.
- **Legend**: Located at the bottom-right corner, with two entries:
- **Solid blue line**: "Softmax with threshold"
- **Dashed red line**: "OpenMax with threshold"
---
### Detailed Analysis
#### Softmax with threshold (Blue Line)
- **Trend**: Starts at ~0.43 accuracy at a threshold of 0.2, rises sharply to a peak of ~0.60 accuracy at a threshold of ~0.6, then declines gradually to ~0.40 accuracy at a threshold of 0.9.
- **Key Data Points**:
- Threshold 0.2 → Accuracy ~0.43
- Threshold 0.4 → Accuracy ~0.55
- Threshold 0.6 → Accuracy ~0.60
- Threshold 0.8 → Accuracy ~0.52
- Threshold 0.9 → Accuracy ~0.40
#### OpenMax with threshold (Red Line)
- **Trend**: Starts at ~0.45 accuracy at a threshold of 0.2, rises to a peak of ~0.61 accuracy at a threshold of ~0.55, then declines steeply to ~0.40 accuracy at a threshold of 0.9.
- **Key Data Points**:
- Threshold 0.2 → Accuracy ~0.45
- Threshold 0.4 → Accuracy ~0.58
- Threshold 0.55 → Accuracy ~0.61
- Threshold 0.7 → Accuracy ~0.54
- Threshold 0.9 → Accuracy ~0.40
---
### Key Observations
1. **Peak Accuracy**:
- OpenMax achieves slightly higher peak accuracy (~0.61) than Softmax (~0.60).
- OpenMax peaks at a lower threshold (0.55) compared to Softmax (0.6).
2. **Decline Behavior**:
- Both methods show a decline in accuracy as the threshold increases beyond their optimal points.
- OpenMax’s decline is steeper after its peak, suggesting greater sensitivity to threshold increases.
3. **Initial Performance**:
- OpenMax starts with higher accuracy at lower thresholds (e.g., 0.45 vs. 0.43 at threshold 0.2).
---
### Interpretation
The graph demonstrates a trade-off between rejection threshold and accuracy for both methods. OpenMax achieves marginally higher accuracy at lower thresholds but degrades more sharply as the threshold increases. Softmax, while slightly less accurate at its peak, maintains a more gradual decline, potentially offering better robustness at higher thresholds. This suggests that the choice between the two methods depends on the application’s tolerance for threshold variability and the priority given to peak accuracy versus stability. The data implies that OpenMax may be preferable for scenarios requiring high accuracy at moderate thresholds, while Softmax might be better suited for applications where threshold flexibility is critical.