## Line Chart: Accuracy vs. Lambda for Different K Values
### Overview
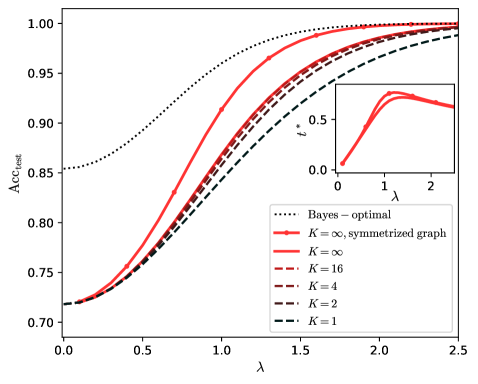
The image is a line chart showing the relationship between test accuracy (Acc_test) and a parameter lambda (λ) for different values of K. An inset plot shows the relationship between t* and lambda. The chart compares the performance of different models with varying K values against a Bayes-optimal baseline.
### Components/Axes
* **X-axis:** λ (lambda), ranging from 0.0 to 2.5 in increments of 0.5.
* **Y-axis:** Acc_test (Test Accuracy), ranging from 0.70 to 1.00 in increments of 0.05.
* **Legend (bottom-left):**
* Black dotted line: Bayes - optimal
* Red line with markers: K = ∞, symmetrized graph
* Red line: K = ∞
* Brown dashed line: K = 16
* Brown dotted-dashed line: K = 4
* Black dashed line: K = 2
* Black dotted-dashed line: K = 1
* **Inset Plot Axes:**
* X-axis: λ (lambda), ranging from 0 to 2 in increments of 1.
* Y-axis: t*, ranging from 0.0 to 0.5 in increments of 0.5.
### Detailed Analysis
**Main Chart:**
* **Bayes - optimal (Black dotted line):** Starts at approximately 0.85 at λ = 0.0 and increases monotonically, approaching 1.00 as λ increases.
* λ = 0.0, Acc_test ≈ 0.85
* λ = 0.5, Acc_test ≈ 0.90
* λ = 1.0, Acc_test ≈ 0.95
* λ = 1.5, Acc_test ≈ 0.97
* λ = 2.0, Acc_test ≈ 0.98
* λ = 2.5, Acc_test ≈ 0.99
* **K = ∞, symmetrized graph (Red line with markers):** Starts at approximately 0.72 at λ = 0.0, increases rapidly, and plateaus near 1.00.
* λ = 0.0, Acc_test ≈ 0.72
* λ = 0.5, Acc_test ≈ 0.80
* λ = 1.0, Acc_test ≈ 0.93
* λ = 1.5, Acc_test ≈ 0.98
* λ = 2.0, Acc_test ≈ 0.99
* λ = 2.5, Acc_test ≈ 0.99
* **K = ∞ (Red line):** Starts at approximately 0.72 at λ = 0.0, increases rapidly, and plateaus near 1.00.
* λ = 0.0, Acc_test ≈ 0.72
* λ = 0.5, Acc_test ≈ 0.78
* λ = 1.0, Acc_test ≈ 0.90
* λ = 1.5, Acc_test ≈ 0.97
* λ = 2.0, Acc_test ≈ 0.99
* λ = 2.5, Acc_test ≈ 0.99
* **K = 16 (Brown dashed line):** Starts at approximately 0.72 at λ = 0.0, increases rapidly, and plateaus near 0.98.
* λ = 0.0, Acc_test ≈ 0.72
* λ = 0.5, Acc_test ≈ 0.76
* λ = 1.0, Acc_test ≈ 0.87
* λ = 1.5, Acc_test ≈ 0.95
* λ = 2.0, Acc_test ≈ 0.97
* λ = 2.5, Acc_test ≈ 0.98
* **K = 4 (Brown dotted-dashed line):** Starts at approximately 0.72 at λ = 0.0, increases rapidly, and plateaus near 0.97.
* λ = 0.0, Acc_test ≈ 0.72
* λ = 0.5, Acc_test ≈ 0.75
* λ = 1.0, Acc_test ≈ 0.84
* λ = 1.5, Acc_test ≈ 0.92
* λ = 2.0, Acc_test ≈ 0.96
* λ = 2.5, Acc_test ≈ 0.97
* **K = 2 (Black dashed line):** Starts at approximately 0.72 at λ = 0.0, increases rapidly, and plateaus near 0.96.
* λ = 0.0, Acc_test ≈ 0.72
* λ = 0.5, Acc_test ≈ 0.74
* λ = 1.0, Acc_test ≈ 0.81
* λ = 1.5, Acc_test ≈ 0.89
* λ = 2.0, Acc_test ≈ 0.94
* λ = 2.5, Acc_test ≈ 0.96
* **K = 1 (Black dotted-dashed line):** Starts at approximately 0.72 at λ = 0.0, increases rapidly, and plateaus near 0.95.
* λ = 0.0, Acc_test ≈ 0.72
* λ = 0.5, Acc_test ≈ 0.73
* λ = 1.0, Acc_test ≈ 0.78
* λ = 1.5, Acc_test ≈ 0.85
* λ = 2.0, Acc_test ≈ 0.92
* λ = 2.5, Acc_test ≈ 0.95
**Inset Plot:**
* **t* vs. λ (Red line with markers):** Starts near 0.0 at λ = 0.0, increases to a maximum around λ = 1.0, and then decreases slightly as λ increases further.
* λ = 0.0, t* ≈ 0.0
* λ = 0.5, t* ≈ 0.3
* λ = 1.0, t* ≈ 0.6
* λ = 1.5, t* ≈ 0.6
* λ = 2.0, t* ≈ 0.5
### Key Observations
* As K increases, the test accuracy generally improves for a given λ.
* The "K = ∞, symmetrized graph" model performs very close to the Bayes-optimal baseline.
* The inset plot shows that t* reaches a maximum around λ = 1.0.
### Interpretation
The chart demonstrates the impact of the parameter K on the test accuracy of a model as a function of λ. Higher values of K generally lead to better performance, with the "K = ∞, symmetrized graph" model achieving results close to the theoretical Bayes-optimal limit. The inset plot suggests that there is an optimal value of λ (around 1.0) that maximizes t*. This information is valuable for tuning the model parameters to achieve the best possible performance. The data suggests that increasing K improves accuracy, but there are diminishing returns as K approaches infinity.