## Line Chart: Test Accuracy vs. Lambda
### Overview
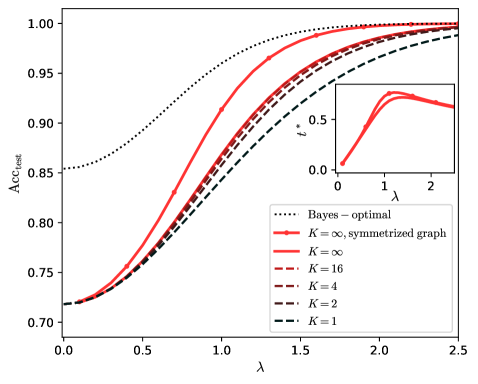
This image presents a line chart illustrating the relationship between test accuracy (Acc<sub>test</sub>) and a parameter lambda (λ) for different values of K. A smaller inset chart shows the relationship between t<sub>r</sub> and lambda. The chart compares the performance of several models, including a Bayes-optimal model and models with varying values of K.
### Components/Axes
* **X-axis:** Lambda (λ), ranging from approximately 0.0 to 2.5.
* **Y-axis:** Test Accuracy (Acc<sub>test</sub>), ranging from approximately 0.70 to 1.00.
* **Legend:** Located in the top-right corner, listing the different models:
* Bayes – optimal (dotted black line)
* K = ∞, symmetrized graph (dark grey solid line)
* K = ∞ (red solid line)
* K = 16 (red dashed line)
* K = 4 (black dashed line)
* K = 2 (black dash-dot line)
* K = 1 (black dotted line)
* **Inset Chart:** Located in the top-right corner.
* **X-axis:** Lambda (λ), ranging from approximately 0.0 to 2.0.
* **Y-axis:** t<sub>r</sub>, ranging from approximately 0.0 to 0.6.
### Detailed Analysis or Content Details
**Main Chart:**
* **Bayes – optimal (dotted black line):** Starts at approximately Acc<sub>test</sub> = 0.82 when λ = 0.0, increases steadily, and reaches approximately Acc<sub>test</sub> = 0.98 when λ = 2.0.
* **K = ∞, symmetrized graph (dark grey solid line):** Starts at approximately Acc<sub>test</sub> = 0.72 when λ = 0.0, increases gradually, and reaches approximately Acc<sub>test</sub> = 0.99 when λ = 2.0.
* **K = ∞ (red solid line):** Starts at approximately Acc<sub>test</sub> = 0.73 when λ = 0.0, increases rapidly between λ = 0.5 and λ = 1.0, and reaches approximately Acc<sub>test</sub> = 0.99 when λ = 2.0.
* **K = 16 (red dashed line):** Starts at approximately Acc<sub>test</sub> = 0.74 when λ = 0.0, increases gradually, and reaches approximately Acc<sub>test</sub> = 0.96 when λ = 2.0.
* **K = 4 (black dashed line):** Starts at approximately Acc<sub>test</sub> = 0.75 when λ = 0.0, increases gradually, and reaches approximately Acc<sub>test</sub> = 0.93 when λ = 2.0.
* **K = 2 (black dash-dot line):** Starts at approximately Acc<sub>test</sub> = 0.76 when λ = 0.0, increases gradually, and reaches approximately Acc<sub>test</sub> = 0.89 when λ = 2.0.
* **K = 1 (black dotted line):** Starts at approximately Acc<sub>test</sub> = 0.77 when λ = 0.0, increases gradually, and reaches approximately Acc<sub>test</sub> = 0.85 when λ = 2.0.
**Inset Chart:**
* The red solid line shows a curve that initially increases rapidly from approximately t<sub>r</sub> = 0.0 when λ = 0.0, reaching a peak of approximately t<sub>r</sub> = 0.55 when λ = 1.0, and then decreases gradually to approximately t<sub>r</sub> = 0.52 when λ = 2.0.
### Key Observations
* The Bayes-optimal model consistently achieves the highest test accuracy across all values of λ.
* The model with K = ∞ exhibits a performance close to the Bayes-optimal model, especially at higher values of λ.
* As K decreases, the test accuracy generally decreases, indicating that a larger value of K leads to better performance.
* The inset chart shows that t<sub>r</sub> peaks around λ = 1.0.
### Interpretation
The chart demonstrates the impact of the parameter K on the test accuracy of a model as a function of lambda. The results suggest that increasing K improves the model's performance, approaching the performance of the Bayes-optimal model as K approaches infinity. The inset chart indicates a relationship between lambda and t<sub>r</sub>, potentially representing a trade-off or characteristic of the model's behavior. The rapid increase in accuracy for K=∞ between λ=0.5 and λ=1.0 suggests a critical threshold or optimal range for lambda when K is large. The decreasing performance with smaller K values highlights the importance of model complexity or the number of parameters in achieving high accuracy. The Bayes-optimal curve serves as an upper bound on achievable accuracy, and the other curves show how different model configurations approach this limit.