## Line Charts: Performance Comparison of Mitigation/Treatment Methods
### Overview
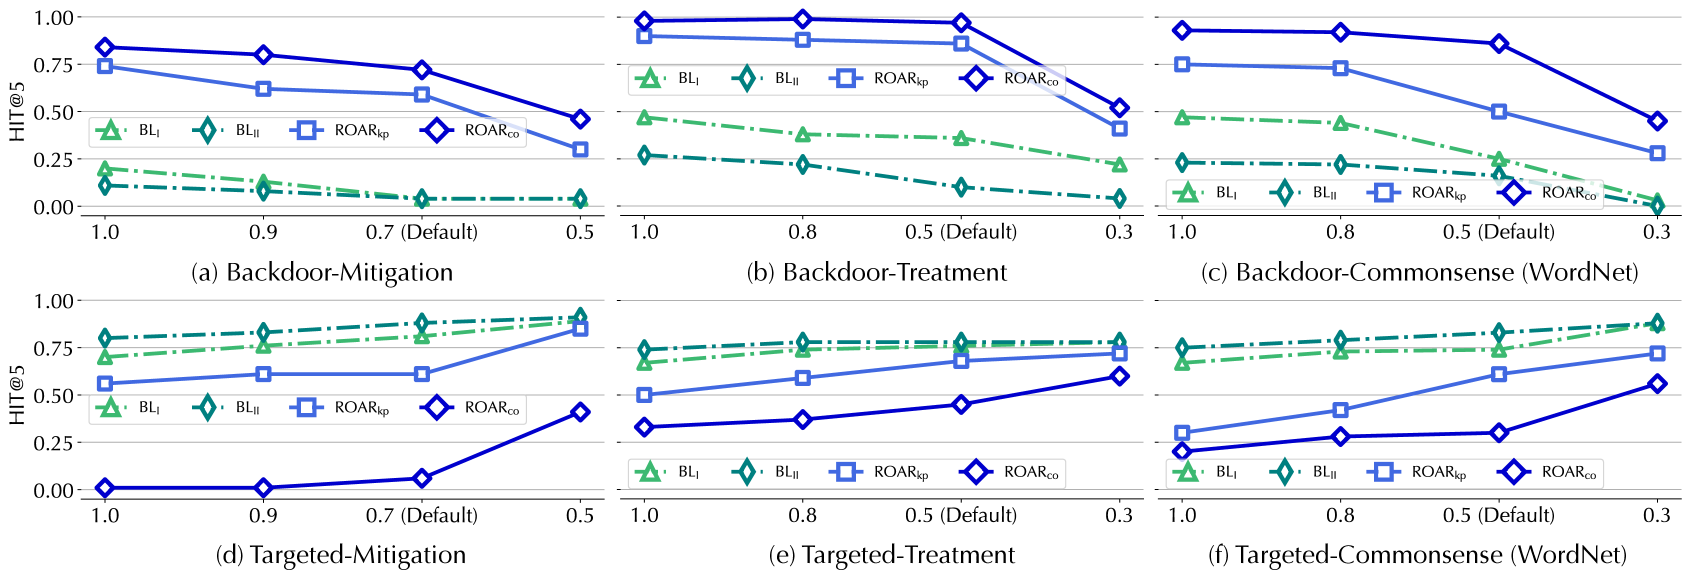
The image presents a 2x3 grid of six line charts, labeled (a) through (f). These charts compare the performance (measured by "HIT@5" on the Y-axis) of four distinct methods ($BL_I$, $BL_{II}$, $ROAR_{kp}$, and $ROAR_{co}$) across different experimental settings. The charts are divided into two rows: the top row (a, b, c) relates to "Backdoor" scenarios, and the bottom row (d, e, f) relates to "Targeted" scenarios.
### Components/Axes
* **Y-Axis:** Labeled "HIT@5" for all charts, with a scale ranging from 0.00 to 1.00.
* **X-Axis:** Represents a parameter value (likely a retention or pruning ratio). The values vary by chart:
* (a) and (d): 1.0, 0.9, 0.7 (Default), 0.5.
* (b), (c), (e), and (f): 1.0, 0.8, 0.5 (Default), 0.3.
* **Legend:** Positioned within each chart (typically bottom-left or center-left). The legend is consistent across all six charts:
* **$BL_I$**: Light green line, triangle marker, dashed line style.
* **$BL_{II}$**: Dark teal/green line, diamond marker, dash-dot line style.
* **$ROAR_{kp}$**: Light blue line, square marker, solid line style.
* **$ROAR_{co}$**: Dark blue line, diamond marker, solid line style.
---
### Detailed Analysis
#### Row 1: Backdoor Scenarios
In these charts, all performance metrics trend **downward** as the X-axis value decreases.
* **(a) Backdoor-Mitigation:**
* $ROAR_{co}$ (Dark Blue): Starts at ~0.85, drops to ~0.45.
* $ROAR_{kp}$ (Light Blue): Starts at ~0.75, drops to ~0.30.
* $BL_I$ (Light Green): Starts at ~0.20, drops to ~0.05.
* $BL_{II}$ (Dark Teal): Starts at ~0.12, drops to ~0.05.
* **(b) Backdoor-Treatment:**
* $ROAR_{co}$: Starts at ~0.98, drops to ~0.50.
* $ROAR_{kp}$: Starts at ~0.90, drops to ~0.40.
* $BL_I$: Starts at ~0.45, drops to ~0.20.
* $BL_{II}$: Starts at ~0.25, drops to ~0.05.
* **(c) Backdoor-Commonsense (WordNet):**
* $ROAR_{co}$: Starts at ~0.95, drops to ~0.45.
* $ROAR_{kp}$: Starts at ~0.75, drops to ~0.30.
* $BL_I$: Starts at ~0.45, drops to ~0.05.
* $BL_{II}$: Starts at ~0.20, drops to ~0.05.
#### Row 2: Targeted Scenarios
In these charts, all performance metrics trend **upward** as the X-axis value decreases.
* **(d) Targeted-Mitigation:**
* $BL_{II}$: Starts at ~0.80, rises to ~0.90.
* $BL_I$: Starts at ~0.70, rises to ~0.85.
* $ROAR_{kp}$: Starts at ~0.55, rises to ~0.85.
* $ROAR_{co}$: Starts at ~0.00, rises to ~0.40.
* **(e) Targeted-Treatment:**
* $BL_{II}$: Starts at ~0.75, rises to ~0.80.
* $BL_I$: Starts at ~0.65, rises to ~0.75.
* $ROAR_{kp}$: Starts at ~0.50, rises to ~0.70.
* $ROAR_{co}$: Starts at ~0.35, rises to ~0.60.
* **(f) Targeted-Commonsense (WordNet):**
* $BL_{II}$: Starts at ~0.75, rises to ~0.90.
* $BL_I$: Starts at ~0.70, rises to ~0.85.
* $ROAR_{kp}$: Starts at ~0.30, rises to ~0.70.
* $ROAR_{co}$: Starts at ~0.20, rises to ~0.55.
---
### Key Observations
1. **Inverse Trends:** The "Backdoor" charts show a positive correlation between the X-axis value and HIT@5 (higher retention = higher HIT@5). The "Targeted" charts show a negative correlation (lower retention = higher HIT@5).
2. **Method Dominance:**
* In **Backdoor** scenarios, the $ROAR$ methods ($ROAR_{co}$ and $ROAR_{kp}$) significantly outperform the baselines ($BL_I$ and $BL_{II}$).
* In **Targeted** scenarios, the baselines ($BL_I$ and $BL_{II}$) generally outperform the $ROAR$ methods, although the gap narrows as the X-axis value decreases.
### Interpretation
The data suggests that the X-axis represents a feature retention ratio (e.g., keeping the top X% of features).
* **Backdoor Scenarios:** The goal is likely to remove backdoor triggers. High retention (1.0) keeps the triggers intact, resulting in high HIT@5 (the model is "fooled"). As retention decreases, the triggers are removed, causing the HIT@5 to drop. The $ROAR$ methods are highly effective at this, as evidenced by their higher initial HIT@5 and steeper decline compared to baselines.
* **Targeted Scenarios:** The goal is likely to improve model accuracy on a specific task. Here, lower retention (0.3) appears to remove noise or irrelevant features, allowing the model to focus on the target, thereby increasing HIT@5. The baselines are more robust in this scenario, while the $ROAR$ methods struggle more at high retention levels but improve as more features are pruned.