## Line Charts: HIT@5 Performance Comparison
### Overview
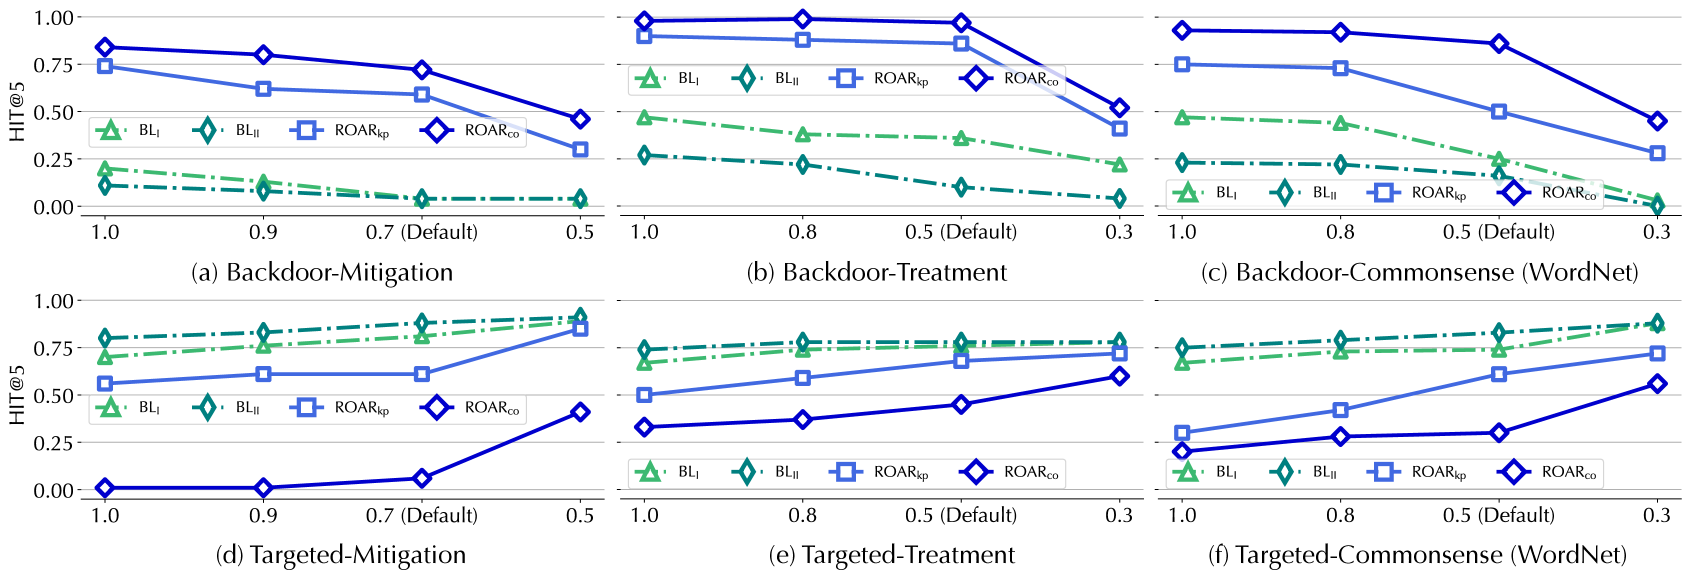
The image presents six line charts arranged in a 2x3 grid, comparing the performance of different methods (BLI, BLII, ROARkp, ROARco) under varying conditions. The y-axis represents HIT@5, a metric for performance, while the x-axis represents a parameter that varies across the charts. The charts are grouped into "Backdoor" and "Targeted" categories, each with "Mitigation," "Treatment," and "Commonsense (WordNet)" subcategories.
### Components/Axes
* **Y-axis:** HIT@5, ranging from 0.00 to 1.00 with increments of 0.25.
* **X-axis:** Varies across charts, with values 1.0, 0.9, 0.8, 0.7 (Default), 0.5, and 0.3.
* **Legends (Top-Right of each chart):**
* Green Triangle: BLI
* Teal Diamond: BLII
* Light Blue Square: ROARkp
* Dark Blue Diamond: ROARco
* **Chart Titles:**
* (a) Backdoor-Mitigation
* (b) Backdoor-Treatment
* (c) Backdoor-Commonsense (WordNet)
* (d) Targeted-Mitigation
* (e) Targeted-Treatment
* (f) Targeted-Commonsense (WordNet)
### Detailed Analysis
**Chart (a): Backdoor-Mitigation**
* **BLI (Green Triangle):** Decreasing trend. Starts at approximately 0.22 at x=1.0 and decreases to approximately 0.12 at x=0.5.
* **BLII (Teal Diamond):** Decreasing trend. Starts at approximately 0.18 at x=1.0 and decreases to approximately 0.08 at x=0.5.
* **ROARkp (Light Blue Square):** Decreasing trend. Starts at approximately 0.78 at x=1.0 and decreases to approximately 0.28 at x=0.5.
* **ROARco (Dark Blue Diamond):** Decreasing trend. Starts at approximately 0.82 at x=1.0 and decreases to approximately 0.78 at x=0.9, 0.65 at x=0.7, and 0.45 at x=0.5.
**Chart (b): Backdoor-Treatment**
* **BLI (Green Triangle):** Decreasing trend. Starts at approximately 0.22 at x=1.0 and decreases to approximately 0.15 at x=0.3.
* **BLII (Teal Diamond):** Decreasing trend. Starts at approximately 0.18 at x=1.0 and decreases to approximately 0.10 at x=0.3.
* **ROARkp (Light Blue Square):** Decreasing trend. Starts at approximately 0.78 at x=1.0 and decreases to approximately 0.28 at x=0.3.
* **ROARco (Dark Blue Diamond):** Decreasing trend. Starts at approximately 0.95 at x=1.0 and decreases to approximately 0.85 at x=0.5, and 0.28 at x=0.3.
**Chart (c): Backdoor-Commonsense (WordNet)**
* **BLI (Green Triangle):** Decreasing trend. Starts at approximately 0.22 at x=1.0 and decreases to approximately 0.12 at x=0.3.
* **BLII (Teal Diamond):** Decreasing trend. Starts at approximately 0.18 at x=1.0 and decreases to approximately 0.08 at x=0.3.
* **ROARkp (Light Blue Square):** Decreasing trend. Starts at approximately 0.78 at x=1.0 and decreases to approximately 0.18 at x=0.3.
* **ROARco (Dark Blue Diamond):** Decreasing trend. Starts at approximately 0.95 at x=1.0 and decreases to approximately 0.10 at x=0.3.
**Chart (d): Targeted-Mitigation**
* **BLI (Green Triangle):** Increasing trend. Starts at approximately 0.75 at x=1.0 and increases to approximately 0.85 at x=0.5.
* **BLII (Teal Diamond):** Increasing trend. Starts at approximately 0.78 at x=1.0 and increases to approximately 0.88 at x=0.5.
* **ROARkp (Light Blue Square):** Increasing trend. Starts at approximately 0.60 at x=1.0 and increases to approximately 0.90 at x=0.5.
* **ROARco (Dark Blue Diamond):** Increasing trend. Starts at approximately 0.00 at x=1.0 and increases to approximately 0.90 at x=0.5.
**Chart (e): Targeted-Treatment**
* **BLI (Green Triangle):** Relatively flat trend. Starts at approximately 0.75 at x=1.0 and remains around 0.75 at x=0.3.
* **BLII (Teal Diamond):** Relatively flat trend. Starts at approximately 0.78 at x=1.0 and remains around 0.80 at x=0.3.
* **ROARkp (Light Blue Square):** Increasing trend. Starts at approximately 0.40 at x=1.0 and increases to approximately 0.80 at x=0.3.
* **ROARco (Dark Blue Diamond):** Increasing trend. Starts at approximately 0.40 at x=1.0 and increases to approximately 0.90 at x=0.3.
**Chart (f): Targeted-Commonsense (WordNet)**
* **BLI (Green Triangle):** Relatively flat trend. Starts at approximately 0.75 at x=1.0 and remains around 0.80 at x=0.3.
* **BLII (Teal Diamond):** Relatively flat trend. Starts at approximately 0.78 at x=1.0 and remains around 0.82 at x=0.3.
* **ROARkp (Light Blue Square):** Increasing trend. Starts at approximately 0.60 at x=1.0 and increases to approximately 0.85 at x=0.3.
* **ROARco (Dark Blue Diamond):** Increasing trend. Starts at approximately 0.60 at x=1.0 and increases to approximately 0.90 at x=0.3.
### Key Observations
* In "Backdoor" scenarios (a, b, c), ROARco consistently starts with the highest HIT@5 but experiences a significant decrease as the x-axis parameter decreases.
* In "Targeted" scenarios (d, e, f), ROARco generally starts with the lowest HIT@5 but shows a substantial increase as the x-axis parameter decreases, often surpassing other methods.
* BLI and BLII generally exhibit similar trends within each chart, with relatively stable or slightly decreasing performance.
* The "Default" value on the x-axis is 0.7 or 0.5, depending on the chart.
### Interpretation
The data suggests that the effectiveness of the different methods (BLI, BLII, ROARkp, ROARco) is highly dependent on the specific scenario (Backdoor vs. Targeted) and the value of the x-axis parameter. ROARco appears to be particularly sensitive to the scenario, performing well initially in "Backdoor" scenarios but declining rapidly, while showing significant improvement in "Targeted" scenarios as the x-axis parameter decreases. This could indicate that ROARco is more adaptable or responsive to specific types of attacks or defenses. The consistent performance of BLI and BLII suggests they are less sensitive to changes in the scenario or parameter, potentially making them more reliable in certain contexts. The x-axis parameter likely represents a variable that influences the attack or defense mechanism, and its impact varies significantly across the different methods.