TECHNICAL ASSET FINGERPRINT
d0fb214c2c17cf917dbc2274
Click to view fullscreen
Press ESC or click to close
FOUND IN PAPERS
EXPERT: gemma-3-27b-it-free VERSION 1
RUNTIME: google-free/gemma-3-27b-it
INTEL_VERIFIED
\n
## Line Chart: Performance Comparison of Backdoor Attacks and Defenses
### Overview
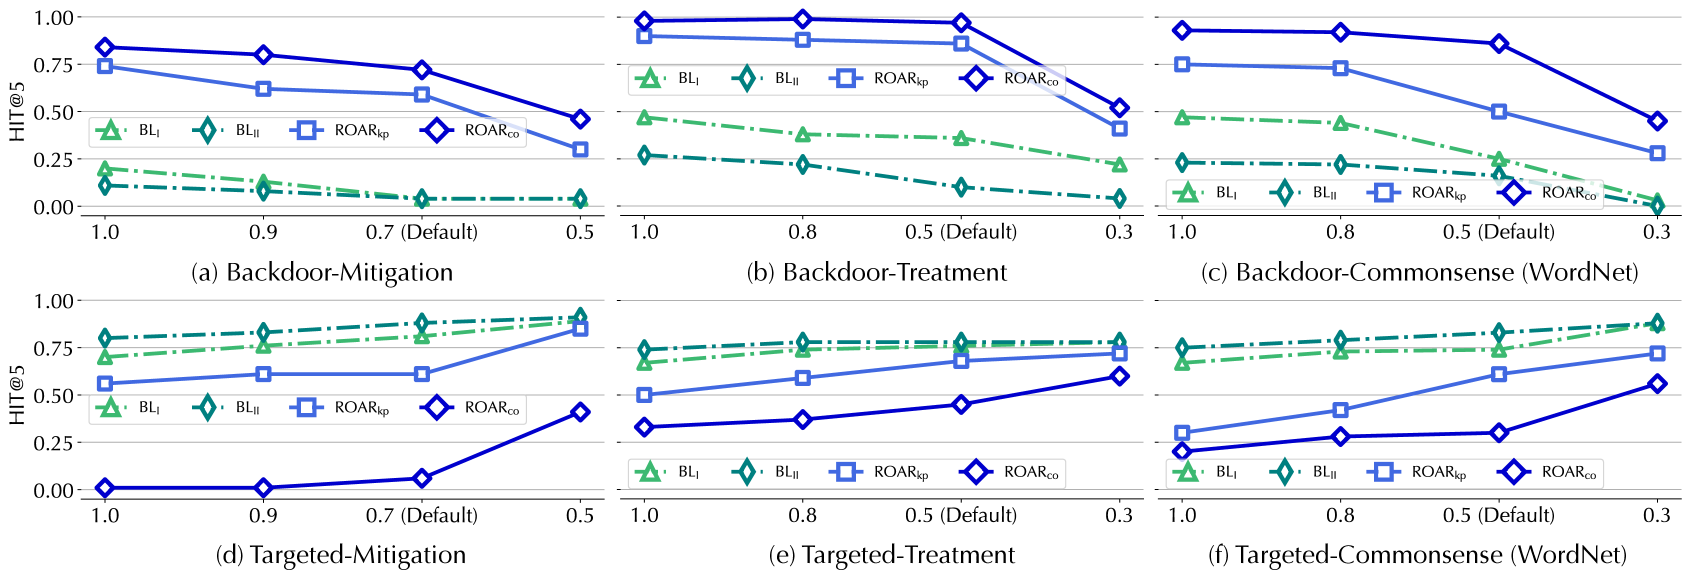
The image presents six line charts, arranged in a 2x3 grid, comparing the performance of different backdoor attack and defense strategies. The charts plot the "HIT@5" metric (likely representing the hit rate within the top 5 predictions) against varying levels of a parameter, presumably a perturbation strength or attack intensity. Each chart focuses on a specific scenario: Backdoor-Mitigation, Backdoor-Treatment, Backdoor-Commonsense (WordNet), Targeted-Mitigation, Targeted-Treatment, and Targeted-Commonsense (WordNet). Four different methods are compared within each scenario: BL<sub>I</sub>, BL<sub>U</sub>, ROAR<sub>Ip</sub>, and ROAR<sub>Co</sub>.
### Components/Axes
* **Y-axis:** "HIT@5" - Ranges from 0.0 to 1.0, with increments of 0.25.
* **X-axis:** Values vary across the charts, but include 1.0, 0.9, 0.7 (labeled "Default"), and 0.5 (in the top row) or 0.8, 0.5 (labeled "Default"), and 0.3 (in the bottom row).
* **Lines:** Represent the performance of different methods.
* BL<sub>I</sub> (Blue Square)
* BL<sub>U</sub> (Blue Diamond)
* ROAR<sub>Ip</sub> (Yellow Circle)
* ROAR<sub>Co</sub> (Green Triangle)
* **Legends:** Located in the top-right corner of each chart, identifying each line by its corresponding symbol and label.
* **Chart Titles:** Located below each chart, indicating the specific scenario being evaluated: (a) Backdoor-Mitigation, (b) Backdoor-Treatment, (c) Backdoor-Commonsense (WordNet), (d) Targeted-Mitigation, (e) Targeted-Treatment, (f) Targeted-Commonsense (WordNet).
### Detailed Analysis or Content Details
**Chart (a) Backdoor-Mitigation:**
* BL<sub>I</sub>: Starts at approximately 0.85, decreases to 0.75 at 0.9, remains relatively stable at 0.75 at 0.7 (Default), and then decreases to 0.65 at 0.5.
* BL<sub>U</sub>: Starts at approximately 0.75, decreases to 0.65 at 0.9, remains relatively stable at 0.65 at 0.7 (Default), and then decreases to 0.55 at 0.5.
* ROAR<sub>Ip</sub>: Starts at approximately 0.25, remains relatively stable at 0.25 at 0.9, remains relatively stable at 0.25 at 0.7 (Default), and then decreases to 0.20 at 0.5.
* ROAR<sub>Co</sub>: Starts at approximately 0.05, remains relatively stable at 0.05 at 0.9, remains relatively stable at 0.05 at 0.7 (Default), and then decreases to 0.00 at 0.5.
**Chart (b) Backdoor-Treatment:**
* BL<sub>I</sub>: Starts at approximately 0.90, decreases to 0.80 at 0.9, remains relatively stable at 0.80 at 0.7 (Default), and then decreases to 0.70 at 0.5.
* BL<sub>U</sub>: Starts at approximately 0.80, decreases to 0.70 at 0.9, remains relatively stable at 0.70 at 0.7 (Default), and then decreases to 0.60 at 0.5.
* ROAR<sub>Ip</sub>: Starts at approximately 0.30, remains relatively stable at 0.30 at 0.9, remains relatively stable at 0.30 at 0.7 (Default), and then decreases to 0.25 at 0.5.
* ROAR<sub>Co</sub>: Starts at approximately 0.10, remains relatively stable at 0.10 at 0.9, remains relatively stable at 0.10 at 0.7 (Default), and then decreases to 0.05 at 0.5.
**Chart (c) Backdoor-Commonsense (WordNet):**
* BL<sub>I</sub>: Starts at approximately 0.90, decreases to 0.80 at 0.9, remains relatively stable at 0.80 at 0.7 (Default), and then decreases to 0.70 at 0.3.
* BL<sub>U</sub>: Starts at approximately 0.80, decreases to 0.70 at 0.9, remains relatively stable at 0.70 at 0.7 (Default), and then decreases to 0.60 at 0.3.
* ROAR<sub>Ip</sub>: Starts at approximately 0.30, remains relatively stable at 0.30 at 0.9, remains relatively stable at 0.30 at 0.7 (Default), and then decreases to 0.25 at 0.3.
* ROAR<sub>Co</sub>: Starts at approximately 0.10, remains relatively stable at 0.10 at 0.9, remains relatively stable at 0.10 at 0.7 (Default), and then decreases to 0.05 at 0.3.
**Chart (d) Targeted-Mitigation:**
* BL<sub>I</sub>: Starts at approximately 0.80, decreases to 0.70 at 0.9, remains relatively stable at 0.70 at 0.7 (Default), and then decreases to 0.60 at 0.5.
* BL<sub>U</sub>: Starts at approximately 0.70, decreases to 0.60 at 0.9, remains relatively stable at 0.60 at 0.7 (Default), and then decreases to 0.50 at 0.5.
* ROAR<sub>Ip</sub>: Starts at approximately 0.80, decreases to 0.70 at 0.9, remains relatively stable at 0.70 at 0.7 (Default), and then decreases to 0.60 at 0.5.
* ROAR<sub>Co</sub>: Starts at approximately 0.70, decreases to 0.60 at 0.9, remains relatively stable at 0.60 at 0.7 (Default), and then decreases to 0.50 at 0.5.
**Chart (e) Targeted-Treatment:**
* BL<sub>I</sub>: Starts at approximately 0.85, decreases to 0.75 at 0.9, remains relatively stable at 0.75 at 0.7 (Default), and then decreases to 0.65 at 0.5.
* BL<sub>U</sub>: Starts at approximately 0.75, decreases to 0.65 at 0.9, remains relatively stable at 0.65 at 0.7 (Default), and then decreases to 0.55 at 0.5.
* ROAR<sub>Ip</sub>: Starts at approximately 0.35, remains relatively stable at 0.35 at 0.9, remains relatively stable at 0.35 at 0.7 (Default), and then decreases to 0.30 at 0.5.
* ROAR<sub>Co</sub>: Starts at approximately 0.15, remains relatively stable at 0.15 at 0.9, remains relatively stable at 0.15 at 0.7 (Default), and then decreases to 0.10 at 0.5.
**Chart (f) Targeted-Commonsense (WordNet):**
* BL<sub>I</sub>: Starts at approximately 0.90, decreases to 0.80 at 0.9, remains relatively stable at 0.80 at 0.7 (Default), and then decreases to 0.70 at 0.3.
* BL<sub>U</sub>: Starts at approximately 0.80, decreases to 0.70 at 0.9, remains relatively stable at 0.70 at 0.7 (Default), and then decreases to 0.60 at 0.3.
* ROAR<sub>Ip</sub>: Starts at approximately 0.30, remains relatively stable at 0.30 at 0.9, remains relatively stable at 0.30 at 0.7 (Default), and then decreases to 0.25 at 0.3.
* ROAR<sub>Co</sub>: Starts at approximately 0.10, remains relatively stable at 0.10 at 0.9, remains relatively stable at 0.10 at 0.7 (Default), and then decreases to 0.05 at 0.3.
### Key Observations
* Generally, increasing the parameter value (moving from 1.0 to 0.3) leads to a decrease in HIT@5 for all methods.
* BL<sub>I</sub> and BL<sub>U</sub> consistently outperform ROAR<sub>Ip</sub> and ROAR<sub>Co</sub> across all scenarios.
* ROAR<sub>Co</sub> consistently exhibits the lowest HIT@5 values, indicating the least effective performance.
* The "Default" value (0.7 or 0.5) often represents a point of inflection, where the rate of performance decline changes.
### Interpretation
The charts demonstrate the effectiveness of different defense mechanisms (BL<sub>I</sub>, BL<sub>U</sub>, ROAR<sub>Ip</sub>, ROAR<sub>Co</sub>) against various backdoor attacks (Mitigation, Treatment, Commonsense) under both standard and targeted attack settings. The HIT@5 metric provides a measure of how well the models maintain their accuracy when faced with these attacks.
The consistent superior performance of BL<sub>I</sub> and BL<sub>U</sub> suggests that these methods are more robust against the evaluated backdoor attacks. Conversely, ROAR<sub>Co</sub> appears to be the least effective, potentially indicating vulnerabilities in its design or implementation.
The decreasing HIT@5 values as the parameter increases suggest that the attack strength or perturbation level negatively impacts the model's performance. The "Default" value likely represents a balance between attack strength and model robustness.
The distinction between "Mitigation," "Treatment," and "Commonsense" scenarios, along with the "Targeted" variations, highlights the importance of considering the specific attack strategy when selecting a defense mechanism. The WordNet component suggests the use of semantic knowledge to improve robustness. The charts provide valuable insights for researchers and practitioners seeking to develop and deploy effective defenses against backdoor attacks in machine learning systems.
DECODING INTELLIGENCE...