## [Line Charts]: HIT@5 Performance of Four Methods Across Backdoor and Targeted Scenarios
### Overview
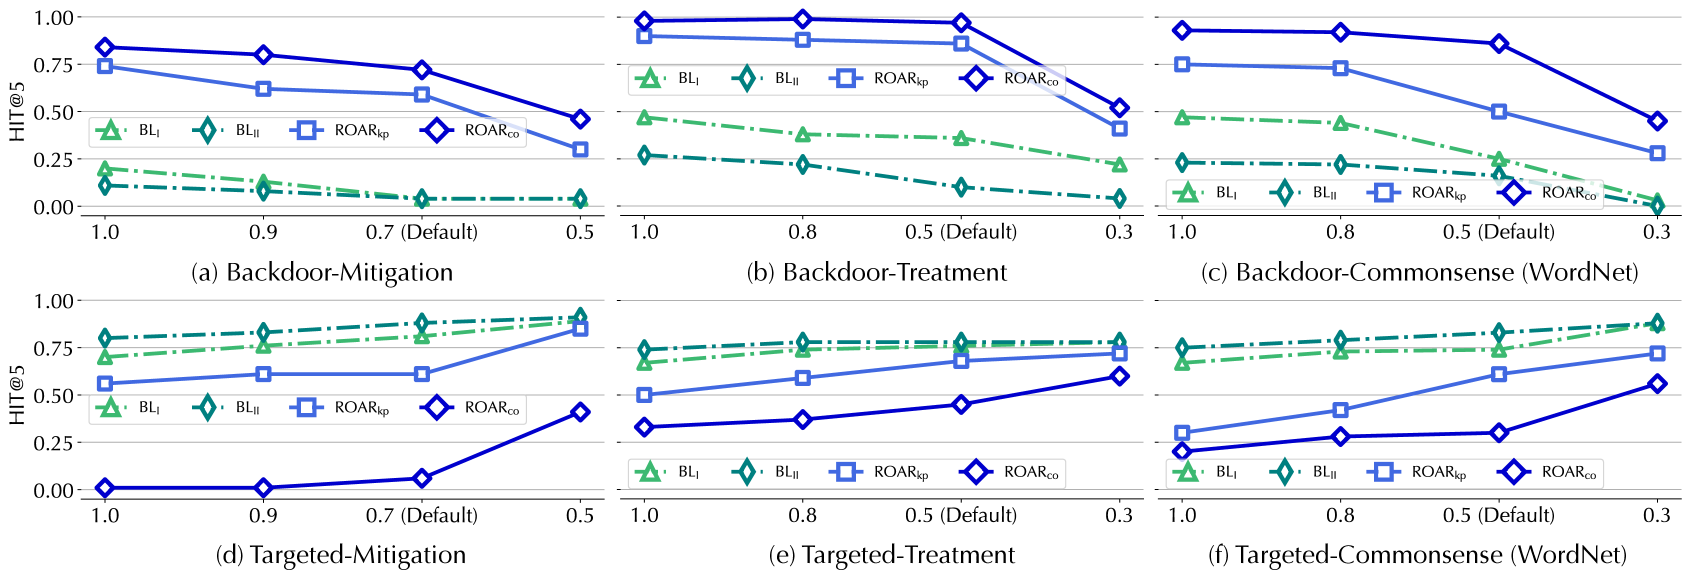
The image contains six line charts (labeled (a)–(f)) arranged in two rows (Backdoor: top; Targeted: bottom) and three columns (Mitigation, Treatment, Commonsense (WordNet)). Each chart plots **HIT@5** (y-axis, 0.00–1.00) against a parameter (x-axis, e.g., threshold/probability) for four methods:
- Baselines: \( \text{BL}_1 \) (green triangle), \( \text{BL}_2 \) (green diamond)
- ROAR variants: \( \text{ROAR}_{\text{kp}} \) (blue square), \( \text{ROAR}_{\text{nn}} \) (blue diamond)
### Components/Axes
- **Y-axis (all charts)**: "HIT@5" (0.00–1.00, increments of 0.25).
- **X-axis (all charts)**: Values (e.g., 1.0, 0.9, 0.7 (Default), 0.5 for (a)/(d); 1.0, 0.8, 0.5 (Default), 0.3 for (b)/(c)/(e)/(f)).
- **Legend (all charts)**: Four methods (color-coded: green = baselines, blue = ROAR variants).
- **Titles**:
- (a) Backdoor-Mitigation
- (b) Backdoor-Treatment
- (c) Backdoor-Commonsense (WordNet)
- (d) Targeted-Mitigation
- (e) Targeted-Treatment
- (f) Targeted-Commonsense (WordNet)
### Detailed Analysis (Per Chart)
#### (a) Backdoor-Mitigation
- **X-axis**: 1.0, 0.9, 0.7 (Default), 0.5
- **Trends**: All methods show **decreasing HIT@5** as x decreases.
- \( \text{BL}_1 \): ~0.2 (1.0) → ~0.05 (0.5)
- \( \text{BL}_2 \): ~0.15 (1.0) → ~0.02 (0.5)
- \( \text{ROAR}_{\text{kp}} \): ~0.75 (1.0) → ~0.3 (0.5)
- \( \text{ROAR}_{\text{nn}} \): ~0.85 (1.0) → ~0.45 (0.5)
#### (b) Backdoor-Treatment
- **X-axis**: 1.0, 0.8, 0.5 (Default), 0.3
- **Trends**: All methods show **decreasing HIT@5** as x decreases.
- \( \text{BL}_1 \): ~0.45 (1.0) → ~0.2 (0.3)
- \( \text{BL}_2 \): ~0.25 (1.0) → ~0.05 (0.3)
- \( \text{ROAR}_{\text{kp}} \): ~0.95 (1.0) → ~0.4 (0.3)
- \( \text{ROAR}_{\text{nn}} \): ~0.98 (1.0) → ~0.5 (0.3)
#### (c) Backdoor-Commonsense (WordNet)
- **X-axis**: 1.0, 0.8, 0.5 (Default), 0.3
- **Trends**: All methods show **decreasing HIT@5** as x decreases.
- \( \text{BL}_1 \): ~0.45 (1.0) → ~0.2 (0.3)
- \( \text{BL}_2 \): ~0.25 (1.0) → ~0.05 (0.3)
- \( \text{ROAR}_{\text{kp}} \): ~0.75 (1.0) → ~0.3 (0.3)
- \( \text{ROAR}_{\text{nn}} \): ~0.95 (1.0) → ~0.45 (0.3)
#### (d) Targeted-Mitigation
- **X-axis**: 1.0, 0.9, 0.7 (Default), 0.5
- **Trends**: All methods show **increasing HIT@5** as x decreases (especially \( \text{ROAR}_{\text{nn}} \), which starts near 0).
- \( \text{BL}_1 \): ~0.7 (1.0) → ~0.9 (0.5)
- \( \text{BL}_2 \): ~0.8 (1.0) → ~0.95 (0.5)
- \( \text{ROAR}_{\text{kp}} \): ~0.55 (1.0) → ~0.85 (0.5)
- \( \text{ROAR}_{\text{nn}} \): ~0.0 (1.0) → ~0.4 (0.5)
#### (e) Targeted-Treatment
- **X-axis**: 1.0, 0.8, 0.5 (Default), 0.3
- **Trends**: All methods show **increasing HIT@5** as x decreases.
- \( \text{BL}_1 \): ~0.7 (1.0) → ~0.85 (0.3)
- \( \text{BL}_2 \): ~0.75 (1.0) → ~0.9 (0.3)
- \( \text{ROAR}_{\text{kp}} \): ~0.5 (1.0) → ~0.75 (0.3)
- \( \text{ROAR}_{\text{nn}} \): ~0.3 (1.0) → ~0.6 (0.3)
#### (f) Targeted-Commonsense (WordNet)
- **X-axis**: 1.0, 0.8, 0.5 (Default), 0.3
- **Trends**: All methods show **increasing HIT@5** as x decreases.
- \( \text{BL}_1 \): ~0.7 (1.0) → ~0.85 (0.3)
- \( \text{BL}_2 \): ~0.75 (1.0) → ~0.9 (0.3)
- \( \text{ROAR}_{\text{kp}} \): ~0.25 (1.0) → ~0.7 (0.3)
- \( \text{ROAR}_{\text{nn}} \): ~0.2 (1.0) → ~0.55 (0.3)
### Key Observations
1. **Backdoor vs. Targeted Trends**:
- Backdoor (a–c): HIT@5 *decreases* with decreasing x (lower thresholds reduce performance).
- Targeted (d–f): HIT@5 *increases* with decreasing x (lower thresholds improve performance).
2. **Method Performance**:
- Backdoor: \( \text{ROAR}_{\text{nn}} \) (blue diamond) and \( \text{ROAR}_{\text{kp}} \) (blue square) outperform baselines (\( \text{BL}_1 \), \( \text{BL}_2 \)) across most x-values.
- Targeted: Baselines (\( \text{BL}_1 \), \( \text{BL}_2 \)) start higher, but \( \text{ROAR}_{\text{nn}} \) (especially in (d)) shows significant improvement with decreasing x.
3. **Default X-Value**: Marked as 0.7 (a, d) or 0.5 (b, c, e, f), likely a baseline parameter (e.g., confidence threshold).
### Interpretation
The charts compare four methods (baselines: \( \text{BL}_1 \), \( \text{BL}_2 \); ROAR variants: \( \text{ROAR}_{\text{kp}} \), \( \text{ROAR}_{\text{nn}} \)) on **HIT@5** (a metric for retrieval/classification) across:
- **Backdoor Scenarios** (Mitigation, Treatment, Commonsense): Lower x-values (e.g., stricter thresholds) reduce performance, but ROAR methods outperform baselines—suggesting ROAR is effective for backdoor-related tasks.
- **Targeted Scenarios** (Mitigation, Treatment, Commonsense): Lower x-values improve performance, with baselines starting higher but \( \text{ROAR}_{\text{nn}} \) showing adaptability (e.g., (d) starts near 0 and rises).
This implies:
- ROAR methods excel at backdoor mitigation/treatment.
- Baselines and \( \text{ROAR}_{\text{nn}} \) perform well in targeted tasks, with performance sensitive to the x-axis parameter (e.g., threshold).
The "Default" x-value (0.7 or 0.5) likely represents a baseline configuration, with deviations (lower x) altering performance as shown.