## Line Graph: Model Performance Across Depths
### Overview
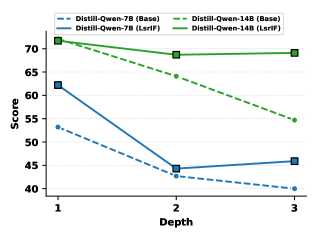
The image is a line graph comparing the performance of two language models, **Distill-Qwen-7B** and **Distill-Qwen-14B**, across three depths (1, 2, 3). Each model is evaluated in two configurations: **Base** (dashed lines) and **LsrlF** (solid lines). The y-axis represents a "Score" metric, while the x-axis represents "Depth."
---
### Components/Axes
- **X-axis (Depth)**: Labeled "Depth" with discrete values at 1, 2, and 3.
- **Y-axis (Score)**: Labeled "Score" with a range from 40 to 70.
- **Legend**: Located in the **top-left corner**, with four entries:
- **Blue dashed line**: Distill-Qwen-7B (Base)
- **Blue solid line**: Distill-Qwen-7B (LsrlF)
- **Green dashed line**: Distill-Qwen-14B (Base)
- **Green solid line**: Distill-Qwen-14B (LsrlF)
---
### Detailed Analysis
#### Data Series Trends
1. **Distill-Qwen-7B (Base, Blue Dashed)**:
- **Depth 1**: ~62
- **Depth 2**: ~45
- **Depth 3**: ~46
- **Trend**: Sharp decline from Depth 1 to 2, followed by a slight recovery at Depth 3.
2. **Distill-Qwen-7B (LsrlF, Blue Solid)**:
- **Depth 1**: ~63
- **Depth 2**: ~44
- **Depth 3**: ~46
- **Trend**: Similar decline to the Base version but with a marginally lower score at Depth 2.
3. **Distill-Qwen-14B (Base, Green Dashed)**:
- **Depth 1**: ~72
- **Depth 2**: ~68
- **Depth 3**: ~69
- **Trend**: Gradual decline from Depth 1 to 2, followed by a slight increase at Depth 3.
4. **Distill-Qwen-14B (LsrlF, Green Solid)**:
- **Depth 1**: ~72
- **Depth 2**: ~64
- **Depth 3**: ~69
- **Trend**: Moderate decline from Depth 1 to 2, followed by a recovery at Depth 3.
---
### Key Observations
- **Model Size Impact**: The 14B models consistently outperform the 7B models across all depths.
- **LsrlF Effect**: The LsrlF configuration improves performance for both models, particularly at Depths 2 and 3.
- **Depth 2 Drop**: All models experience a significant score drop at Depth 2, suggesting a potential challenge or bottleneck at this depth.
- **Recovery at Depth 3**: Both models show partial recovery at Depth 3, with LsrlF versions performing better than Base.
---
### Interpretation
The graph demonstrates that larger models (14B) maintain higher performance across depths compared to smaller models (7B). The **LsrlF** configuration mitigates performance degradation, especially for the 7B model, which shows a steeper decline at Depth 2. This suggests that LsrlF may enhance robustness or generalization in resource-constrained scenarios. The 14B models’ higher baseline scores and smaller performance drop at Depth 2 indicate greater capacity to handle deeper tasks. The recovery at Depth 3 for both models implies that LsrlF helps stabilize performance in later stages, potentially addressing overfitting or computational limitations.