## Donut Chart: Level Distribution
### Overview
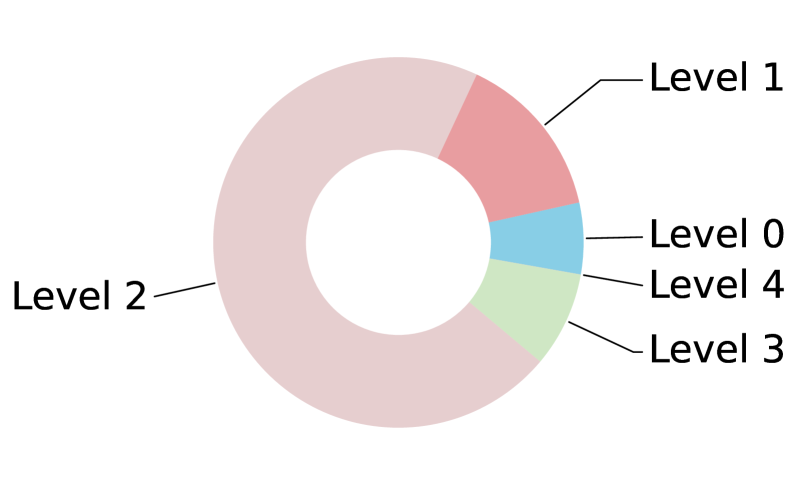
The image is a donut chart illustrating the distribution of different levels. The chart is divided into five segments, each representing a level (Level 0, Level 1, Level 2, Level 3, and Level 4). The size of each segment corresponds to the proportion of that level in the overall distribution.
### Components/Axes
* **Chart Type:** Donut Chart
* **Levels:** Level 0, Level 1, Level 2, Level 3, Level 4
* **Colors:**
* Level 0: Light Blue
* Level 1: Light Red
* Level 2: Light Pink
* Level 3: Light Green
* Level 4: Unspecified (but visually distinct)
### Detailed Analysis
* **Level 0:** Represented by a light blue segment. The segment appears to be approximately 5-10% of the total area.
* **Level 1:** Represented by a light red segment. The segment appears to be approximately 10-15% of the total area.
* **Level 2:** Represented by a light pink segment. This segment is the largest, occupying approximately 60-70% of the total area.
* **Level 3:** Represented by a light green segment. The segment appears to be approximately 5-10% of the total area.
* **Level 4:** The color is not explicitly stated, but it is located between Level 0 and Level 3. The segment appears to be approximately 5-10% of the total area.
### Key Observations
* Level 2 dominates the distribution, accounting for the majority of the data.
* Levels 0, 1, 3, and 4 have relatively small proportions compared to Level 2.
* The exact numerical values for each level are not provided, but the relative sizes of the segments give a visual representation of their proportions.
### Interpretation
The donut chart provides a visual representation of the distribution of different levels. The dominance of Level 2 suggests that it is the most prevalent level in the dataset. The other levels (0, 1, 3, and 4) are less common. Without specific numerical values, it's difficult to draw precise conclusions, but the chart effectively highlights the relative proportions of each level.