\n
## Donut Chart: Level Distribution
### Overview
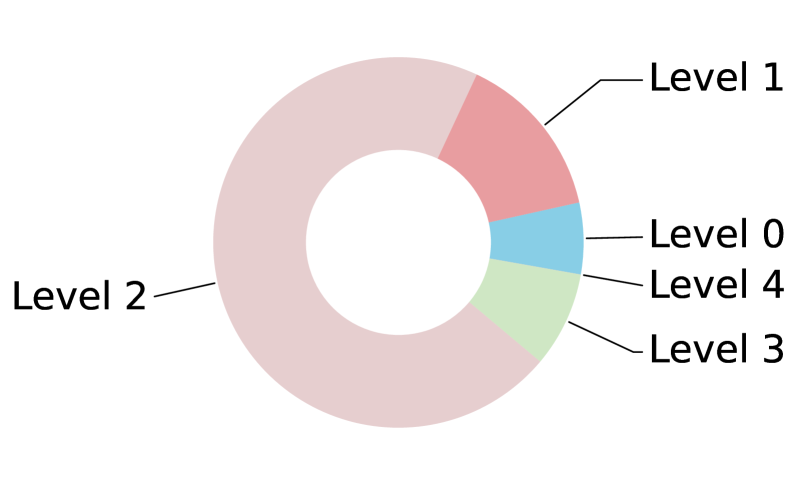
The image presents a donut chart illustrating the distribution of values across five levels: Level 0, Level 1, Level 2, Level 3, and Level 4. The chart visually represents the proportion of each level relative to the whole. No numerical values are provided on the chart itself.
### Components/Axes
* **Chart Type:** Donut Chart
* **Levels:** Level 0, Level 1, Level 2, Level 3, Level 4
* **Legend:** Located on the right side of the chart, associating colors with each level.
* **Colors:**
* Level 0: Light Blue
* Level 1: Light Red
* Level 2: Light Pink
* Level 3: Light Green
* Level 4: Pale Green
### Detailed Analysis
The chart is divided into five segments, each representing a level.
* **Level 1 (Light Red):** Occupies the largest portion of the donut, approximately 60-65% of the total area.
* **Level 2 (Light Pink):** Represents a significant portion, approximately 20-25% of the total area.
* **Level 0 (Light Blue):** A small segment, estimated at around 5-7% of the total area.
* **Level 3 (Light Green):** A small segment, estimated at around 5-7% of the total area.
* **Level 4 (Pale Green):** A small segment, estimated at around 3-5% of the total area.
### Key Observations
Level 1 dominates the distribution, representing the largest proportion of the data. Levels 0, 3, and 4 are relatively small, indicating they contribute less to the overall distribution. Level 2 is the second largest.
### Interpretation
The chart suggests a highly skewed distribution, with Level 1 being the most prevalent category. This could represent a variety of scenarios depending on the context of the data. For example, it could indicate a concentration of data points in a specific category, a majority preference, or a dominant characteristic within the dataset. Without knowing what the "Levels" represent, it's difficult to draw more specific conclusions. The small proportions of Levels 0, 3, and 4 suggest they are less common or less significant in the context of the data. The chart is descriptive, but lacks quantitative data to support detailed analysis.