## Donut Chart: Distribution by Level
### Overview
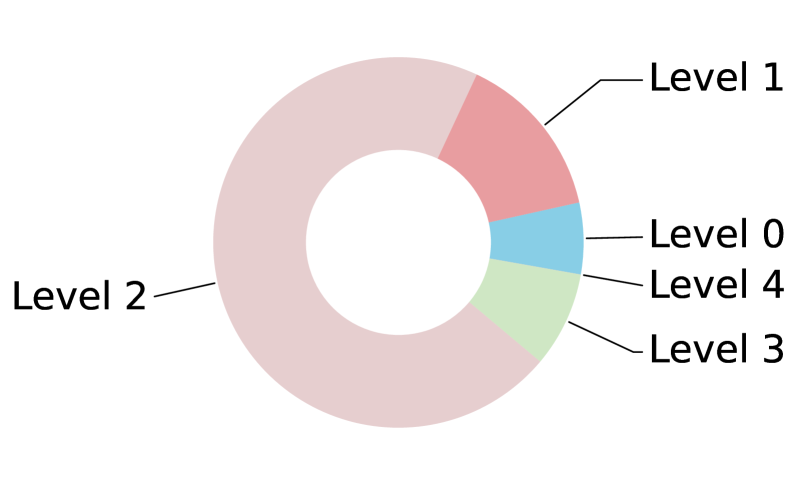
The image displays a donut chart (a pie chart with a central hole) illustrating the proportional distribution of five categories labeled "Level 0" through "Level 4." The chart is presented on a plain white background with no title, numerical values, or percentage labels. The segments are distinguished by color and are identified by external labels connected via lines.
### Components/Axes
* **Chart Type:** Donut Chart.
* **Categories (Segments):** Five distinct segments, each corresponding to a "Level."
* **Labels & Legend:** Labels are placed outside the chart, connected to their respective segments by thin black lines. There is no separate legend; the labels serve as the legend.
* **Level 0:** Label positioned to the right of the chart, pointing to a small, light blue segment.
* **Level 1:** Label positioned to the upper right, pointing to a medium-sized, pinkish-red segment.
* **Level 2:** Label positioned to the left, pointing to the largest segment, which is a pale, dusty pink color.
* **Level 3:** Label positioned to the lower right, pointing to a small, light green segment.
* **Level 4:** Label positioned to the right (between Level 0 and Level 3), pointing to a very small segment whose color is not distinctly visible but appears to be a darker shade adjacent to the light blue of Level 0.
* **Spatial Layout:** The chart is centered. The largest segment (Level 2) occupies the entire left hemisphere and extends into the bottom-right quadrant. The remaining segments are clustered in the upper-right and right-hand side of the chart.
### Detailed Analysis
* **Segment Proportions (Visual Estimation):**
* **Level 2:** This is the dominant segment, visually estimated to represent approximately **70-75%** of the total chart area. It spans from roughly the 12 o'clock position counter-clockwise to about the 4 o'clock position.
* **Level 1:** The second-largest segment, estimated at **15-20%**. It occupies the area from approximately 12 o'clock to 2 o'clock.
* **Level 3:** A small segment, estimated at **5-8%**. It is located from about 4 o'clock to 5 o'clock.
* **Level 0:** A smaller segment, estimated at **3-5%**. It is positioned between Level 1 and Level 4, from roughly 2 o'clock to 3 o'clock.
* **Level 4:** The smallest segment, estimated at **1-3%**. It is a thin slice between Level 0 and Level 3.
* **Trend/Order:** The segments are not arranged in a clear numerical order (0,1,2,3,4) around the chart. The sequence clockwise from the top appears to be: Level 1, Level 0, Level 4, Level 3, then the large Level 2 segment completing the circle.
### Key Observations
1. **Dominance of Level 2:** The most striking feature is the overwhelming size of the Level 2 segment, indicating it represents the vast majority of whatever is being measured.
2. **Minimal Representation of Level 4:** Level 4 constitutes a negligible portion of the whole.
3. **Non-Sequential Arrangement:** The levels are not plotted in ascending or descending order around the donut, which may imply the ordering is based on another factor (e.g., categorical grouping) rather than magnitude.
4. **Lack of Quantitative Data:** The chart provides no numerical values, percentages, or a total count, making precise analysis impossible. All proportions are visual estimates.
### Interpretation
This donut chart effectively communicates a **highly skewed distribution**. The data suggests that the entity or phenomenon being categorized is predominantly characterized by "Level 2," with "Level 1" being a significant but secondary component. "Levels 0, 3, and 4" are marginal or minor categories.
The absence of a title or context limits interpretation. This could represent anything from the distribution of user engagement levels on a platform, severity levels in a system, or tiers in a classification system. The key takeaway is the extreme imbalance: any process, resource allocation, or analysis related to this data should focus overwhelmingly on Level 2, while acknowledging the small but present contributions of the other levels. The non-sequential ordering of labels might be a design choice for visual balance or could hint at an underlying categorical relationship not explained in the image itself.