## Pie Chart: Distribution of Levels
### Overview
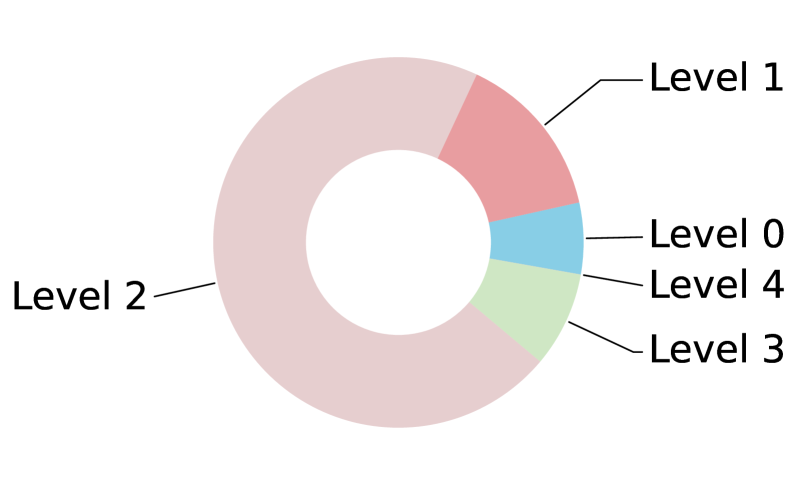
The image depicts a pie chart divided into four segments, each labeled with a "Level" designation (0–4). The chart uses distinct colors to differentiate categories, with a legend on the right side mapping labels to colors. The largest segment dominates the chart, while smaller segments occupy the remaining space.
### Components/Axes
- **Legend**: Positioned on the right side of the chart, with labels and corresponding colors:
- **Level 0**: Blue (#00BFFF)
- **Level 1**: Red (#FF6347)
- **Level 2**: Light Pink (#FFB6C1)
- **Level 3**: Green (#90EE90)
- **Level 4**: Light Blue (#ADD8E6)
- **Labels**: Each segment is annotated with its "Level" designation (e.g., "Level 2" for the largest segment).
- **No axes or scales**: The chart is a standard pie chart without numerical axes.
### Detailed Analysis
- **Level 2 (Light Pink)**: Occupies the largest portion of the chart, estimated to be **~55–60%** of the total area. This segment is positioned prominently on the left side of the pie.
- **Level 1 (Red)**: The second-largest segment, estimated at **~20–25%**, located adjacent to Level 2.
- **Level 3 (Green)**: A smaller segment, estimated at **~10–15%**, positioned near the bottom-right of the chart.
- **Level 4 (Light Blue)**: The smallest segment, also estimated at **~5–10%**, located near Level 3.
- **Level 0 (Blue)**: The smallest segment, estimated at **~5–10%**, positioned near the top-right of the chart.
### Key Observations
1. **Dominance of Level 2**: Level 2 constitutes the majority of the distribution, suggesting it is the most prevalent category.
2. **Hierarchical Imbalance**: Levels 3 and 4 are significantly smaller than Levels 1 and 2, indicating a potential hierarchy where lower-numbered levels are more common.
3. **Color Consistency**: All legend labels match their corresponding segment colors without discrepancies.
### Interpretation
The chart likely represents a distribution of entities (e.g., users, tasks, or data points) across hierarchical levels. The overwhelming dominance of Level 2 suggests it is the baseline or most common category, while Levels 3 and 4 are rare or specialized. The small size of Level 0 implies it may represent an outlier or a less frequent state. The lack of numerical values introduces uncertainty, but the visual proportions strongly emphasize the disparity between Level 2 and the other categories. This could reflect a system where higher-level categories (e.g., advanced users or complex tasks) are underrepresented compared to foundational levels.