## Heatmap: Category Distribution Across Layers and Heads
### Overview
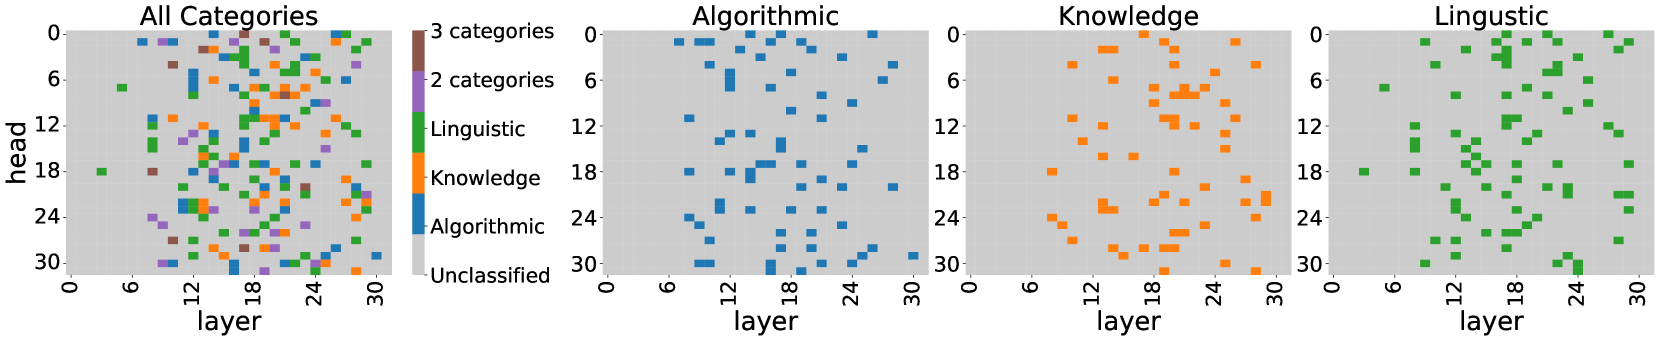
The image presents four heatmaps displaying the distribution of different categories across layers and heads of a model. The first heatmap shows "All Categories," while the subsequent heatmaps focus on "Algorithmic," "Knowledge," and "Linguistic" categories individually. The heatmaps use color to indicate the presence of a category at a specific layer and head combination.
### Components/Axes
* **Titles:** "All Categories," "Algorithmic," "Knowledge," "Linguistic"
* **Y-axis:** "head" with tick marks at 0, 6, 12, 18, 24, and 30.
* **X-axis:** "layer" with tick marks at 0, 6, 12, 18, 24, and 30.
* **Legend (located to the right of the "All Categories" heatmap):**
* Brown: "3 categories"
* Purple: "2 categories"
* Green: "Linguistic"
* Orange: "Knowledge"
* Blue: "Algorithmic"
* Gray: "Unclassified" (This is the background color of the heatmaps)
### Detailed Analysis
**1. All Categories Heatmap:**
This heatmap shows a mix of all categories.
* Brown squares (3 categories) are sparsely distributed.
* Purple squares (2 categories) are also sparsely distributed.
* Green squares (Linguistic) are scattered throughout the heatmap.
* Orange squares (Knowledge) are scattered throughout the heatmap.
* Blue squares (Algorithmic) are scattered throughout the heatmap.
**2. Algorithmic Heatmap:**
This heatmap shows the distribution of the "Algorithmic" category (blue squares).
* Blue squares are present across all layers and heads, but are not densely packed.
* There appears to be a slightly higher concentration of blue squares in the lower layers (layer 18-30).
**3. Knowledge Heatmap:**
This heatmap shows the distribution of the "Knowledge" category (orange squares).
* Orange squares are present across all layers and heads, but are not densely packed.
* There appears to be a slightly higher concentration of orange squares in the middle layers (layer 6-18).
**4. Linguistic Heatmap:**
This heatmap shows the distribution of the "Linguistic" category (green squares).
* Green squares are present across all layers and heads, but are not densely packed.
* The distribution appears relatively uniform across layers and heads.
### Key Observations
* The "All Categories" heatmap confirms that the other three categories ("Algorithmic," "Knowledge," and "Linguistic") are present in the combined view.
* The individual heatmaps show the specific distribution of each category.
* The heatmaps are sparse, indicating that most layer/head combinations are not strongly associated with a single category.
### Interpretation
The heatmaps visualize the distribution of different categories across the layers and heads of a model. The sparsity of the heatmaps suggests that individual layer/head combinations are not strongly specialized for a single category. The "All Categories" heatmap provides a combined view, while the individual heatmaps allow for a more detailed analysis of each category's distribution. The slight variations in concentration across layers for "Algorithmic" and "Knowledge" might indicate some degree of specialization at different depths of the model. The presence of "2 categories" and "3 categories" indicates overlap between the categories.