\n
## Scatter Plots: Category Activation by Layer and Head
### Overview
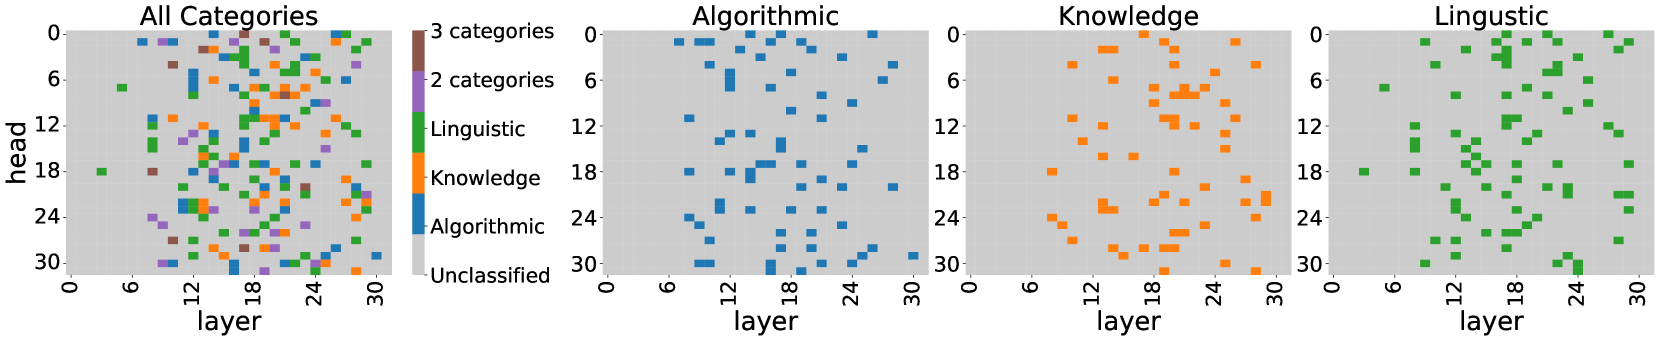
The image presents four scatter plots, each visualizing the activation of different categories across layers and heads. The plots show the distribution of activations, likely representing the strength of a particular category's response within a neural network model. Each plot focuses on a specific category (All Categories, Algorithmic, Knowledge, Linguistic) and displays activation levels against layer and head indices.
### Components/Axes
Each plot shares the following components:
* **X-axis:** "layer", ranging from approximately 0 to 32, with markers at 0, 6, 12, 18, 24, and 30.
* **Y-axis:** "head", ranging from approximately 0 to 32, with markers at 0, 6, 12, 18, 24, and 30.
* **Color:** Represents the number of categories activated. The colorbar on the "All Categories" plot indicates:
* Green: 3 categories
* Yellow/Orange: 2 categories
* Blue: 1 category
* **Plot Titles:** Each plot is labeled with the category it represents: "All Categories", "Algorithmic", "Knowledge", "Linguistic".
### Detailed Analysis or Content Details
**1. All Categories Plot:**
* The plot displays a dense scattering of points, with a gradient of colors indicating the number of categories activated.
* The highest concentration of points (green, 3 categories) is located in the lower-left quadrant (low layer, low head) and extends diagonally upwards and to the right.
* There's a noticeable transition from green to yellow/orange and then to blue as the layer and head indices increase.
* The points are relatively evenly distributed across the layer and head dimensions.
**2. Algorithmic Plot:**
* This plot shows a sparse scattering of blue points (1 category).
* The points are concentrated in the lower layer range (0-18) and lower head range (0-12).
* There is a slight upward trend in head index as the layer index increases.
* No points are visible in the upper-right quadrant (high layer, high head).
**3. Knowledge Plot:**
* This plot displays orange/yellow points (2 categories) and some blue points (1 category).
* The points are primarily concentrated in the higher layer range (12-30) and mid-range head indices (6-24).
* There's a clear clustering of points around layer 24 and head 12.
* The distribution appears more concentrated than the "Algorithmic" plot.
**4. Linguistic Plot:**
* This plot shows a dense scattering of green points (3 categories) and some yellow/orange points (2 categories).
* The points are concentrated in the higher layer range (18-30) and higher head range (12-30).
* The distribution is relatively uniform across the upper-right quadrant.
* There is a clear concentration of points in the upper-right corner.
### Key Observations
* The "All Categories" plot shows a broad activation pattern, while the individual category plots reveal more specific activation regions.
* "Algorithmic" activations are primarily in the lower layers and heads.
* "Knowledge" activations are concentrated in the higher layers and mid-range heads.
* "Linguistic" activations are dominant in the higher layers and heads.
* The number of activated categories varies significantly across the different plots.
### Interpretation
The data suggests that different categories are processed at different layers and heads within the neural network. "Algorithmic" information appears to be processed earlier in the network (lower layers), while "Knowledge" and "Linguistic" information are processed later (higher layers). The varying density of points and the number of activated categories indicate that some categories are more strongly represented or require more complex processing than others. The concentration of "Knowledge" activations around layer 24 and head 12 might indicate a specific module or component responsible for processing knowledge-related information. The "All Categories" plot provides a holistic view, showing how these individual category activations contribute to the overall network activity. The plots demonstrate a hierarchical processing structure, where lower layers extract basic features and higher layers combine these features to represent more complex concepts. The differences in activation patterns across categories suggest that the network has learned to specialize different parts of its architecture for different types of information.