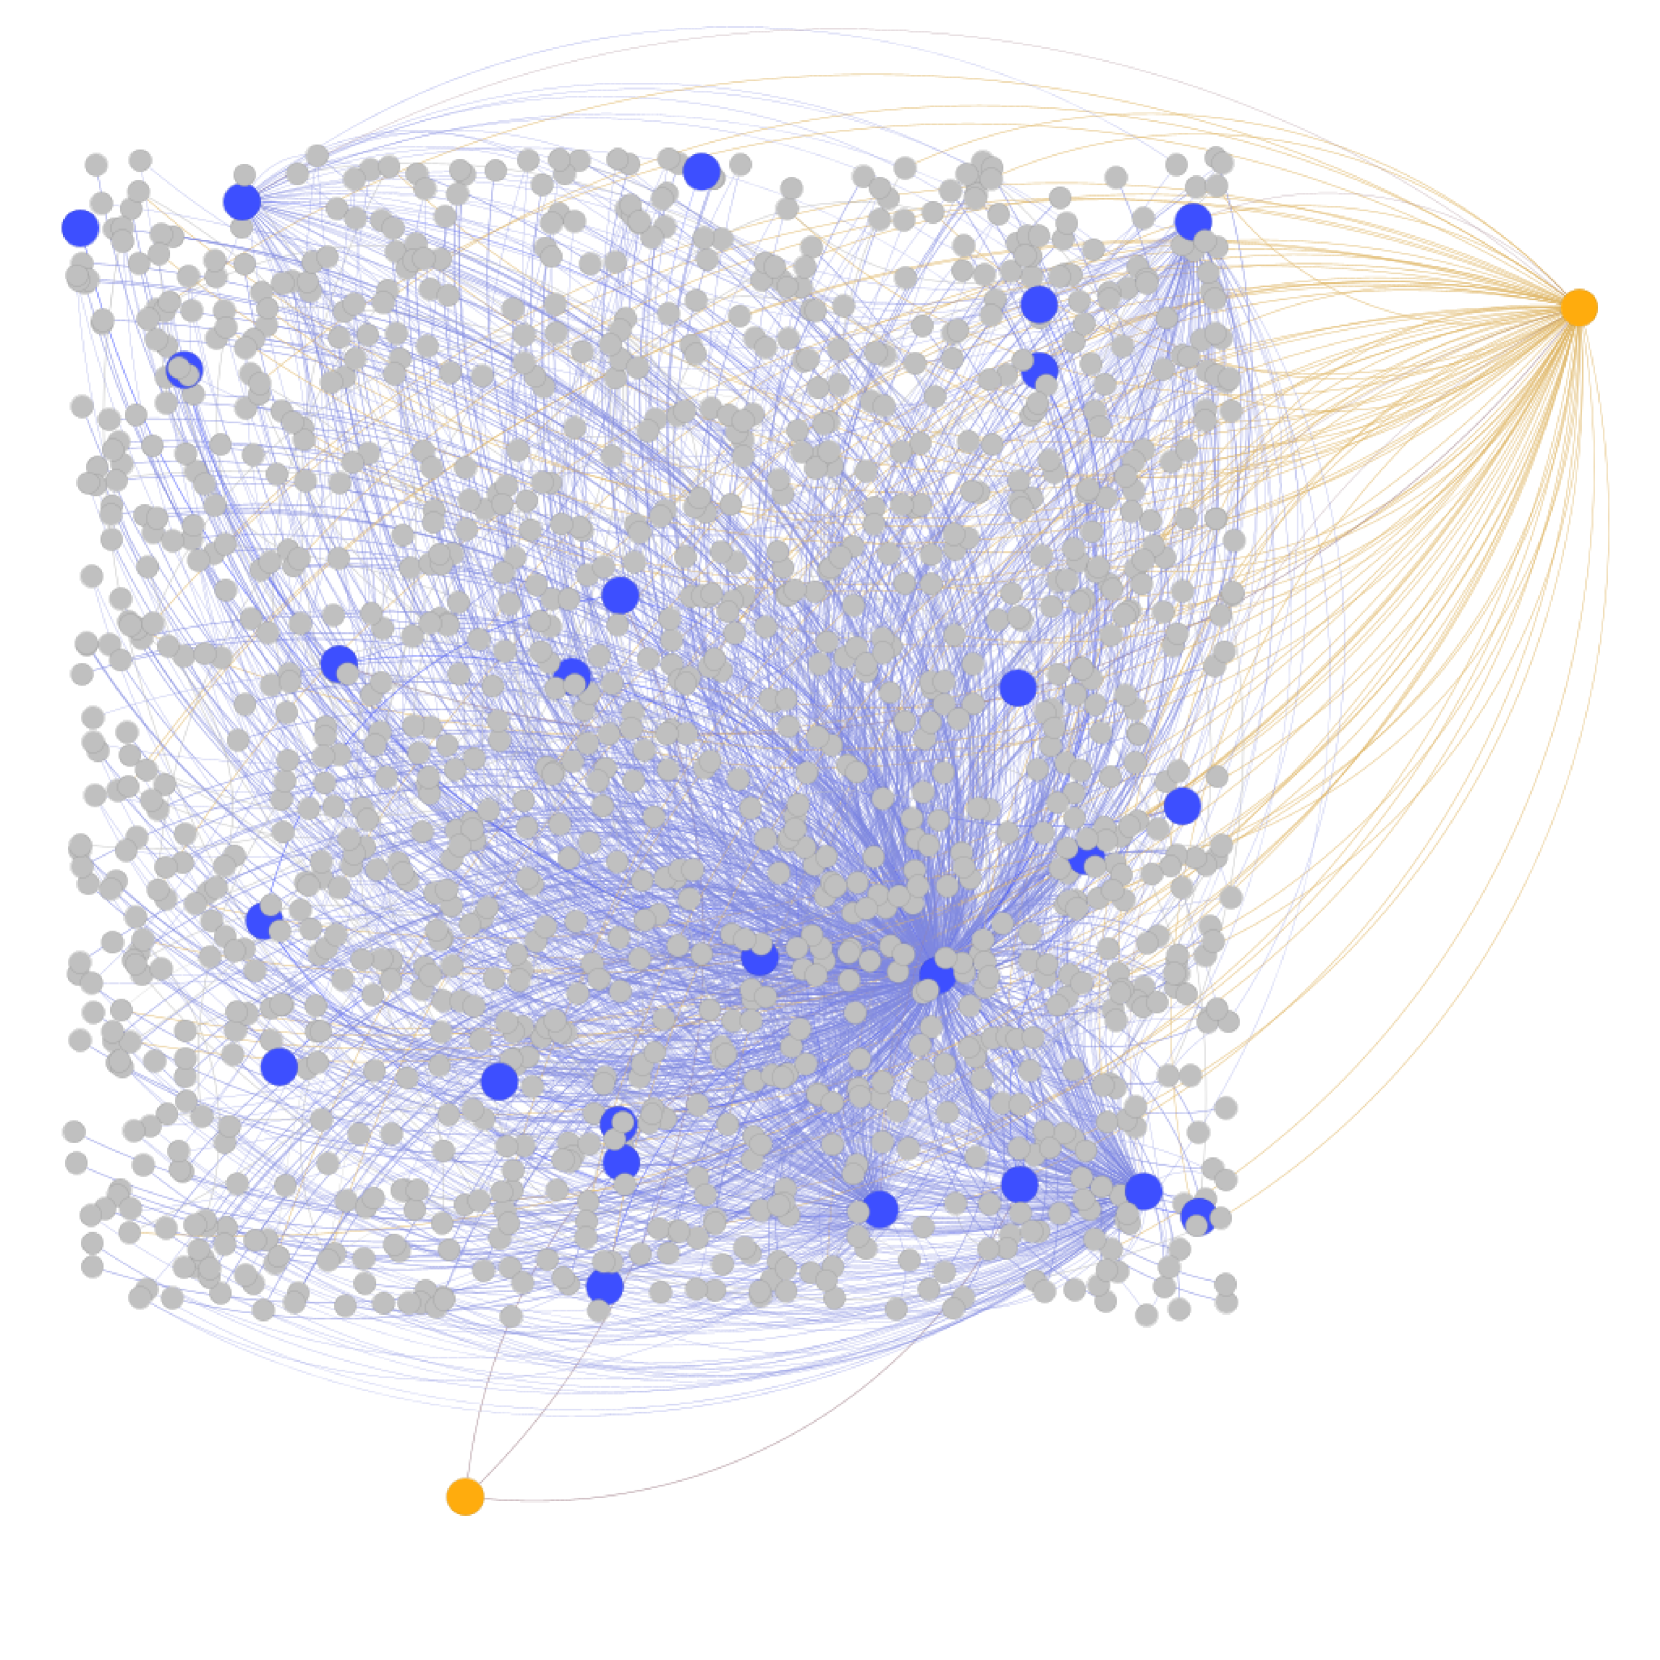
## Network Diagram: Node Connectivity
### Overview
The image is a network diagram illustrating the connectivity between nodes. It features a dense cluster of gray nodes interconnected with blue lines, several larger blue nodes scattered throughout the cluster, and one prominent orange node located on the right side of the diagram. The orange node is connected to the gray node cluster via orange lines.
### Components/Axes
* **Nodes:** Represented by circles. There are three types of nodes:
* Gray nodes: Small, numerous, and densely clustered.
* Blue nodes: Larger than gray nodes, fewer in number, and distributed within the gray node cluster.
* Orange node: Single, located on the right, and connected to the gray node cluster.
* **Edges:** Represented by lines connecting the nodes. There are two types of edges:
* Blue lines: Connect the gray nodes to each other and to the blue nodes.
* Orange lines: Connect the orange node to the gray nodes.
### Detailed Analysis
* **Gray Nodes:** These nodes form the bulk of the network. They are interconnected with blue lines, creating a dense web of connections.
* **Blue Nodes:** These nodes are larger and fewer in number compared to the gray nodes. They are distributed throughout the gray node cluster and are also connected to the gray nodes via blue lines. There are approximately 20-30 blue nodes.
* **Orange Node:** This node is located on the right side of the diagram and is connected to the gray node cluster via orange lines. The orange lines appear to radiate from the orange node towards the gray node cluster.
* **Connectivity:** The gray nodes are highly interconnected, forming a dense network. The blue nodes appear to act as hubs within the gray node network. The orange node serves as a central point connecting to the gray node cluster.
### Key Observations
* The gray nodes form the core of the network, with a high degree of interconnectedness.
* The blue nodes may represent important nodes within the network, given their larger size and distribution.
* The orange node appears to be a significant point of connection to the gray node cluster.
### Interpretation
The network diagram likely represents a complex system where the gray nodes represent individual entities, the blue nodes represent key influencers or hubs, and the orange node represents a central authority or external connection. The density of the blue lines suggests a high degree of interaction and communication within the gray node cluster. The orange node's connection to the gray node cluster via orange lines indicates a flow of information or influence from the orange node to the gray nodes. The diagram could represent social networks, communication networks, or any other system where interconnectedness and influence are key factors.