\n
## Network Graph: Relationship Visualization
### Overview
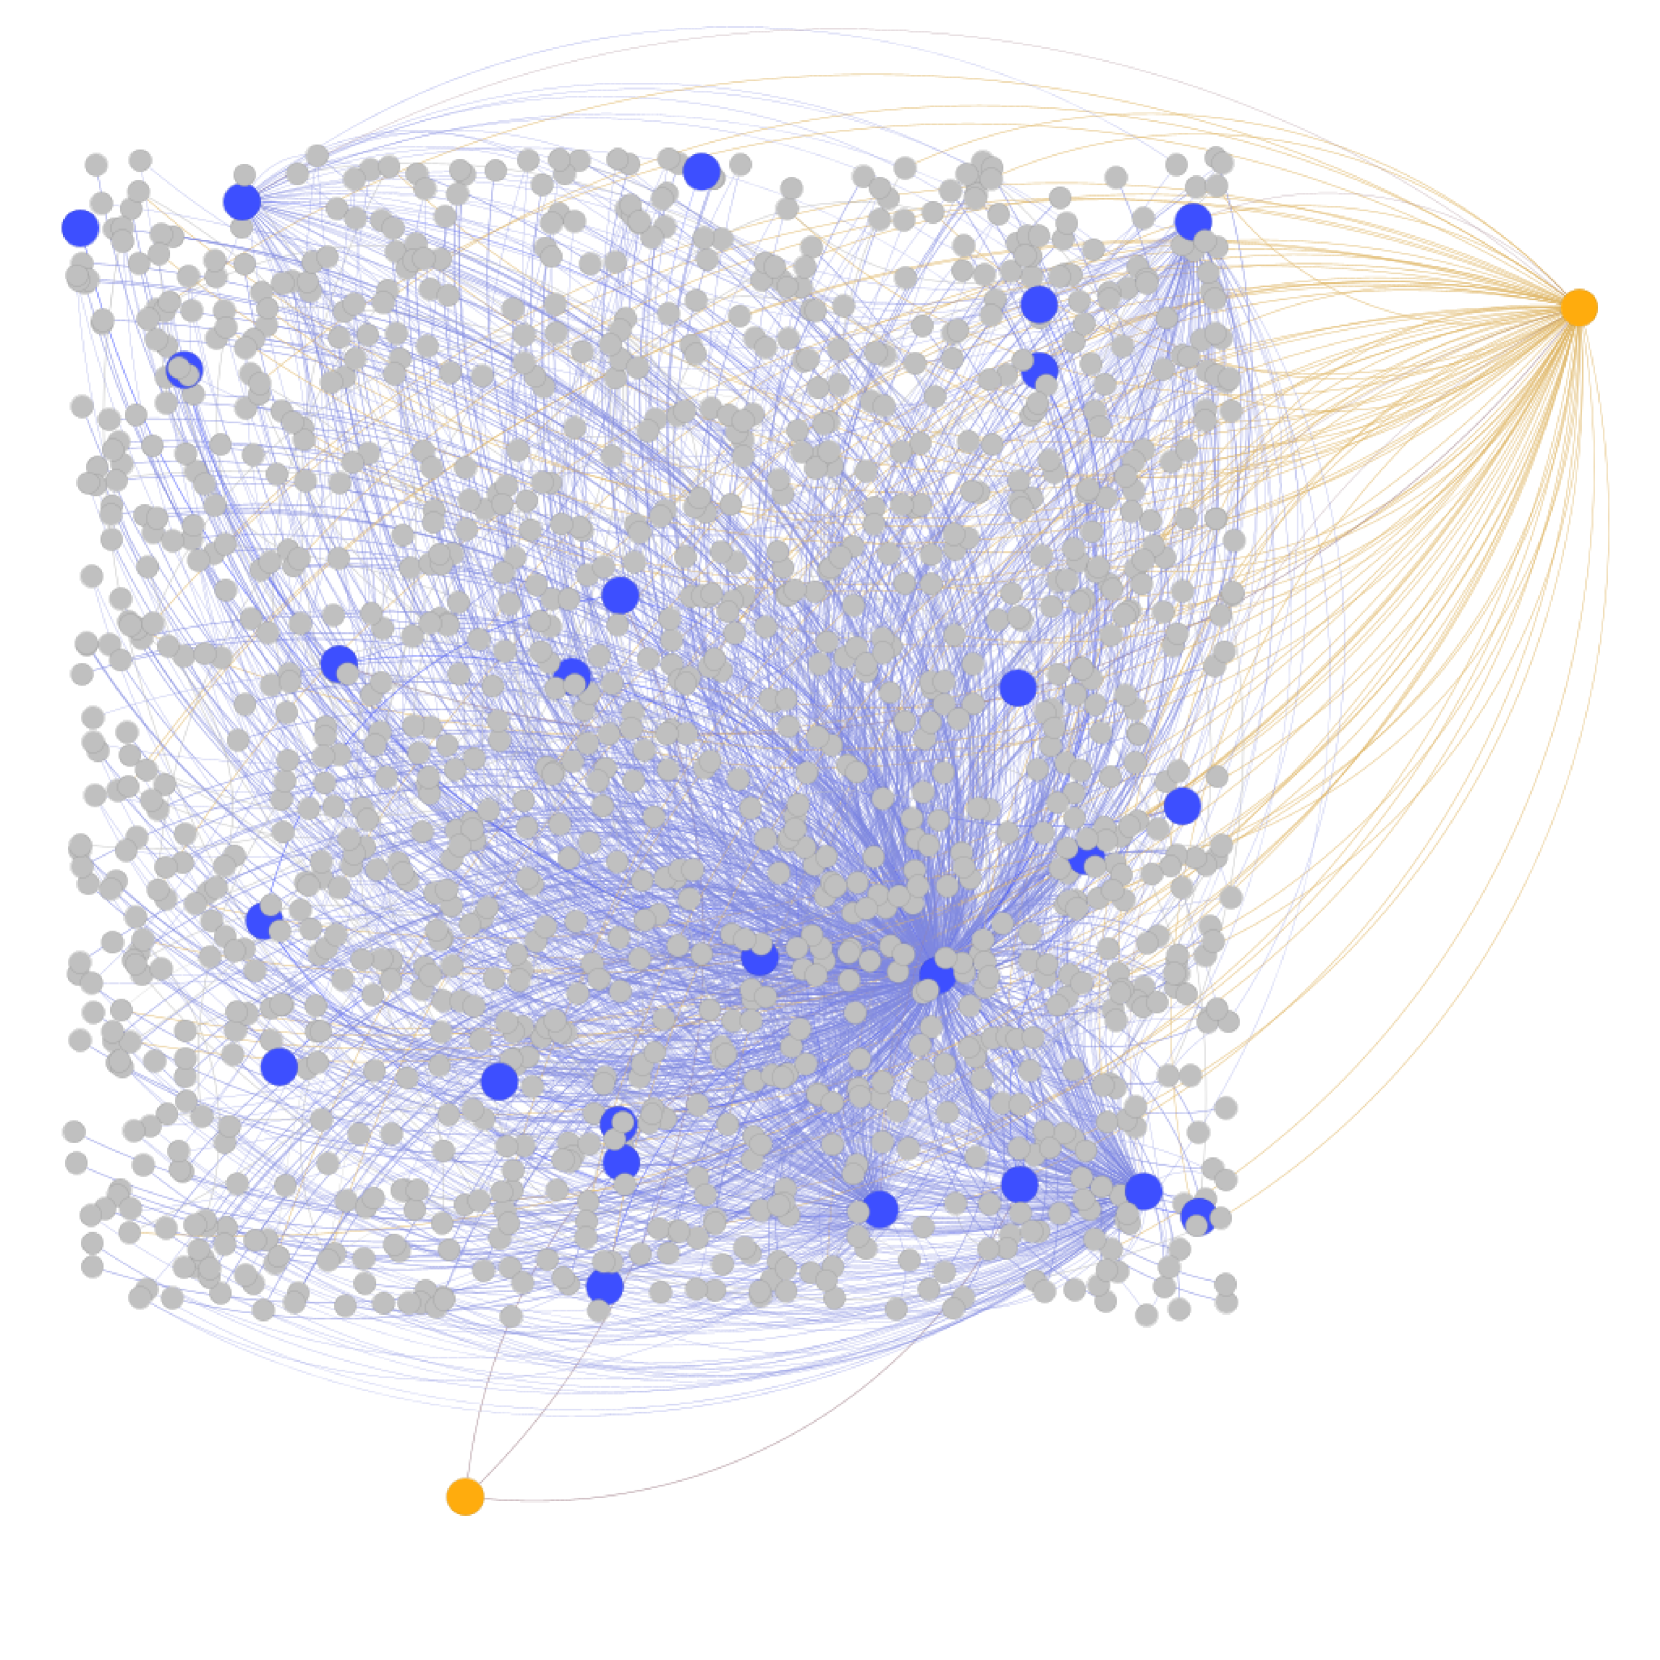
The image depicts a network graph visualizing relationships between nodes. The graph consists of a large number of nodes (approximately 200-300) connected by edges. The nodes are differentiated by size and color, suggesting varying degrees of importance or categorization. There are two distinct color schemes: gray nodes with blue highlights, and orange nodes. The graph appears to have a central cluster of blue-highlighted nodes, with connections radiating outwards to the gray nodes, and a separate set of connections extending from the orange nodes.
### Components/Axes
There are no explicit axes or scales present in the image. The graph's structure itself defines the relationships. The components are:
* **Nodes:** Represent entities or concepts.
* **Edges:** Represent relationships between nodes.
* **Node Colors:** Gray, Blue, and Orange.
* **Node Sizes:** Varying, likely indicating importance or degree.
* **Edge Colors:** Light blue and light orange.
### Detailed Analysis or Content Details
The graph can be divided into two main sections based on the color of the nodes:
**Section 1: Gray and Blue Nodes (Main Cluster)**
* The majority of nodes are gray (approximately 170-220).
* A subset of gray nodes are highlighted in blue (approximately 20-30). These blue nodes are concentrated in the center-left of the image.
* The blue nodes are interconnected with a dense network of light blue edges.
* Edges radiate from the blue nodes to the surrounding gray nodes. The density of connections appears to decrease as distance from the blue nodes increases.
* The size of the blue nodes varies, with some being significantly larger than others. The largest blue nodes are located in the center of the cluster.
**Section 2: Orange Nodes**
* There are two orange nodes.
* One orange node is located in the bottom-center of the image.
* The other orange node is located in the top-right corner of the image.
* Light orange edges connect the orange node in the top-right to a significant number of gray nodes, primarily those in the upper-left quadrant of the graph.
* The orange node in the bottom-center is connected to a small number of gray nodes.
**Approximate Node Counts:**
* Gray Nodes: ~200
* Blue Nodes: ~25
* Orange Nodes: 2
**Edge Density:**
* High density within the blue node cluster.
* Moderate density radiating from blue nodes to gray nodes.
* Moderate density connecting the top-right orange node to gray nodes.
* Low density connecting the bottom-center orange node to gray nodes.
### Key Observations
* The blue nodes appear to be central to the network, acting as hubs connecting to many gray nodes.
* The orange node in the top-right corner has a strong influence on a subset of the gray nodes, distinct from the influence of the blue nodes.
* The orange node in the bottom-center has limited influence.
* The varying sizes of the blue nodes suggest a hierarchy or differing levels of importance within the central cluster.
* The graph lacks any explicit labels or quantitative data, making precise analysis difficult.
### Interpretation
This network graph likely represents relationships within a complex system. The blue nodes could represent key individuals, concepts, or entities within a core group. The gray nodes represent peripheral elements connected to the core. The orange nodes represent external influences or separate groups that interact with the main network.
The strong connection between the top-right orange node and a specific subset of gray nodes suggests a targeted influence or relationship. The limited connection of the bottom-center orange node suggests a weaker or more isolated interaction.
The lack of labels makes it impossible to determine the specific meaning of the nodes and edges. However, the graph structure suggests a hierarchical network with a central core and external influences. The varying node sizes within the blue cluster indicate differing levels of importance or centrality within the core group.
The graph could represent social networks, information flow, or any system where relationships between entities are important. Further investigation would require understanding the context and meaning of the nodes and edges. The visualization suggests a system where information or influence flows primarily through the blue nodes, with the orange node in the top-right exerting a significant influence on a specific portion of the network.