## Network Diagram: Organizational or Social Network Structure
### Overview
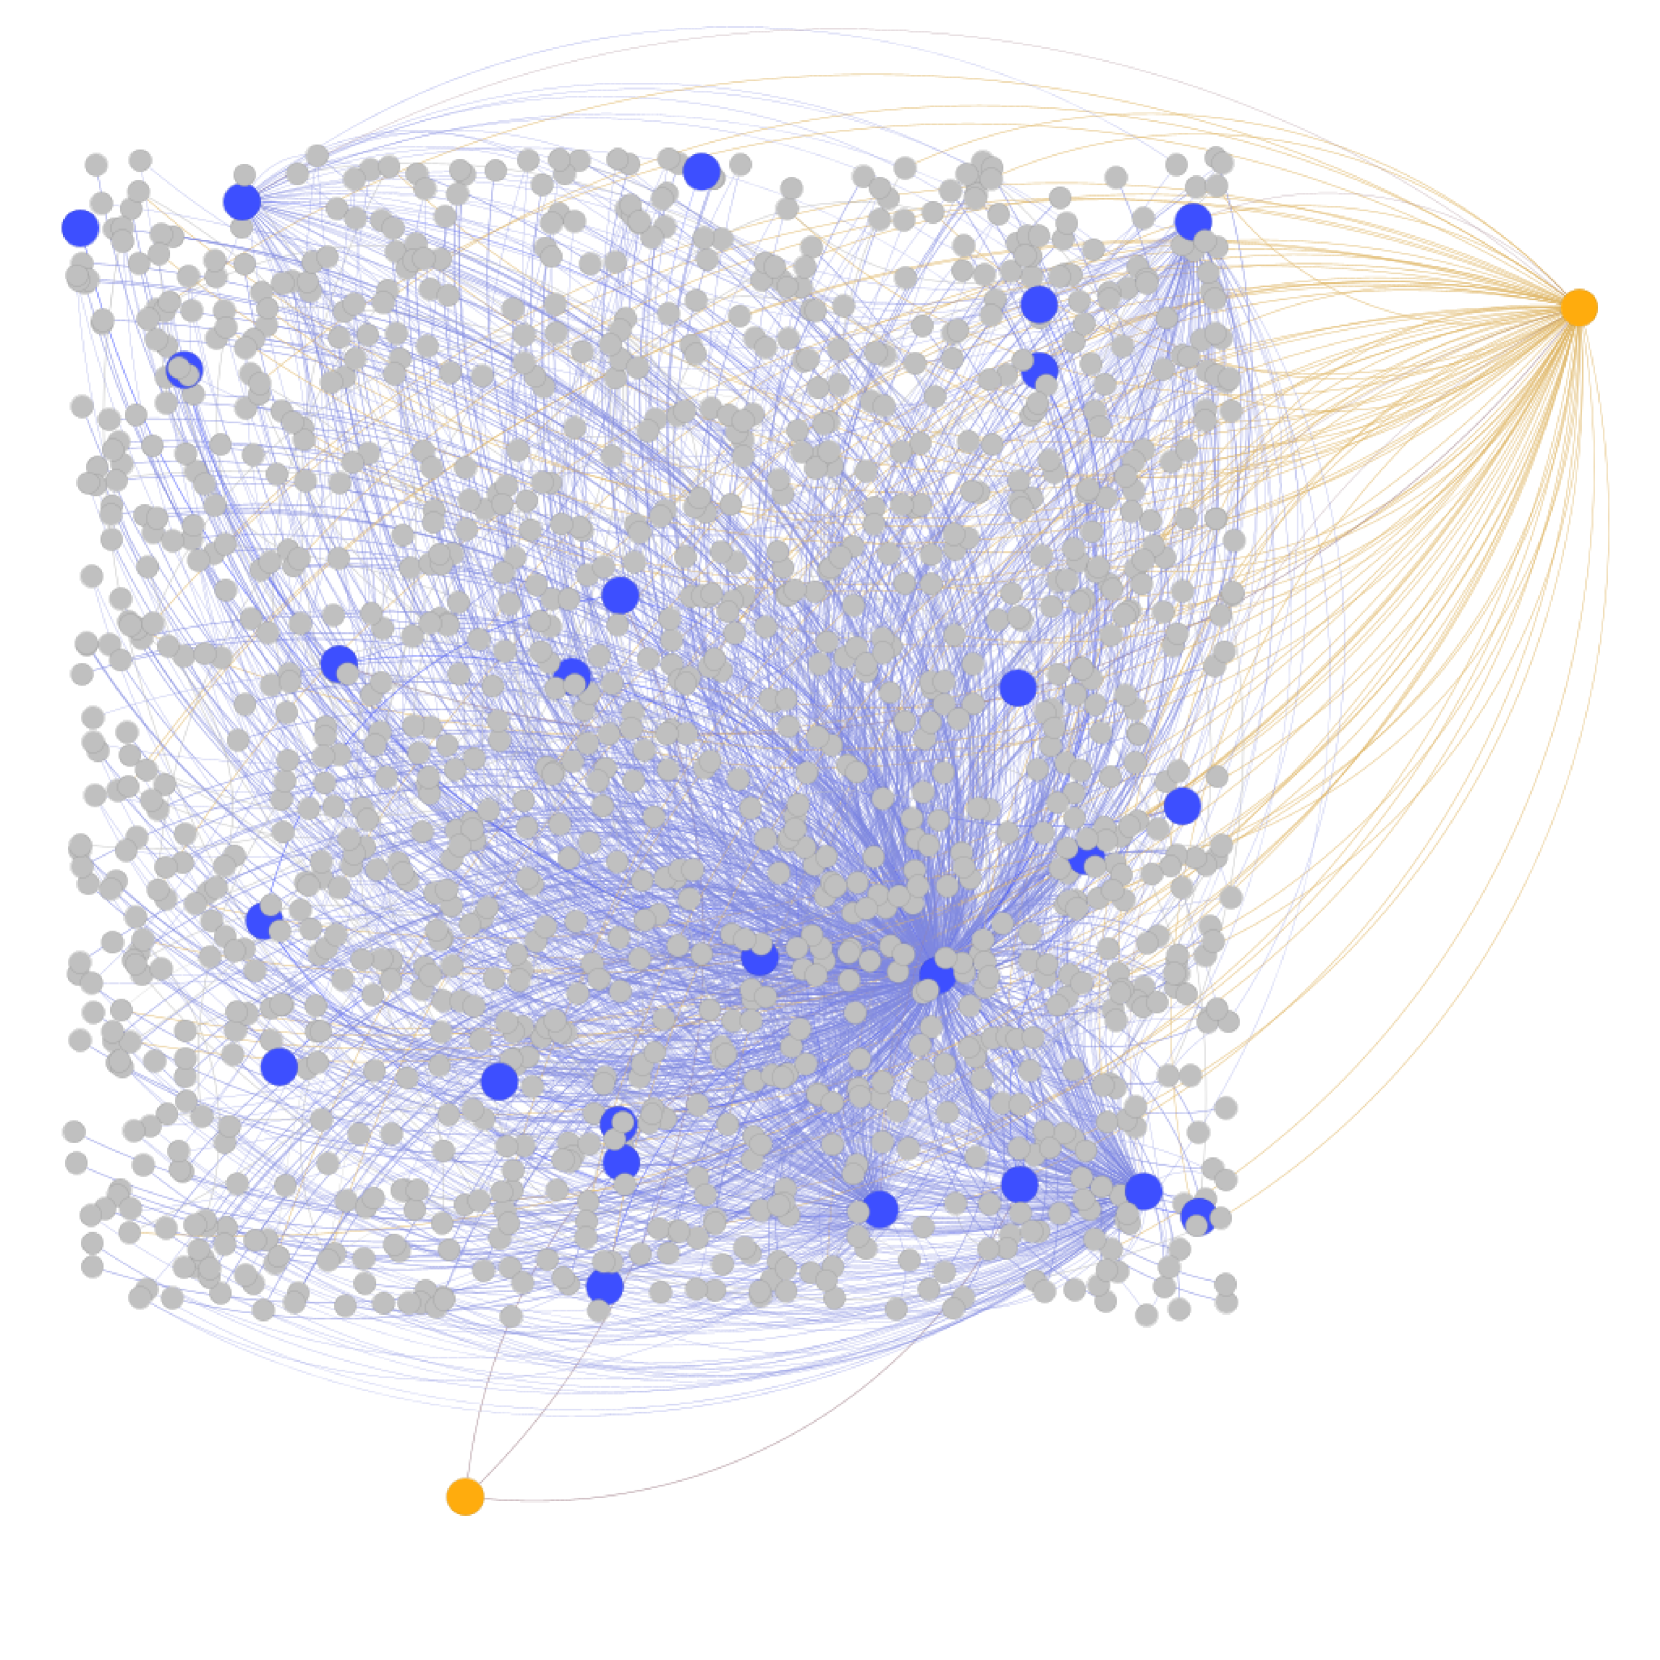
The image depicts a complex network diagram with interconnected nodes and pathways. Nodes are represented as circles of varying sizes and colors, connected by lines. The diagram lacks explicit labels, axis titles, or legends, but visual patterns suggest hierarchical or relational relationships.
### Components/Axes
- **Nodes**:
- **Gray nodes**: Dominant in the network, representing the majority of entities.
- **Blue nodes**: Smaller in size, centrally located, and densely connected to gray nodes.
- **Orange nodes**: Two distinct nodes (one at the top-right, one at the bottom-left) with significantly larger size and fewer connections.
- **Connections**:
- **Blue lines**: Connect gray and blue nodes, forming dense clusters.
- **Orange lines**: Radiate from the two orange nodes, connecting to gray nodes in a star-like pattern.
- **Spatial Layout**:
- Orange nodes are positioned at the periphery (top-right and bottom-left).
- Blue nodes cluster near the center, acting as intermediaries.
- Gray nodes form the bulk of the network, with connections radiating outward.
### Detailed Analysis
- **Node Sizes and Colors**:
- Orange nodes are ~3x larger than blue nodes and ~10x larger than gray nodes.
- Blue nodes are centrally located, suggesting higher connectivity or importance.
- **Connection Patterns**:
- Orange nodes have ~15-20 direct connections each, while blue nodes have ~50-70.
- Gray nodes average ~10-15 connections, with most links to blue nodes.
- **Flow Direction**:
- Orange nodes act as "hubs," with connections radiating outward to gray nodes.
- Blue nodes form a dense core, with bidirectional connections to gray nodes.
### Key Observations
1. **Centrality of Blue Nodes**: Blue nodes are critical connectors, bridging gray nodes and orange hubs.
2. **Peripheral Orange Nodes**: Orange nodes are isolated from each other, suggesting independent roles or functions.
3. **Lack of Labels**: No textual identifiers or legends are present, limiting direct interpretation of node roles.
4. **Color Coding**: Blue and orange lines may indicate different relationship types (e.g., primary vs. secondary connections).
### Interpretation
This diagram likely represents a network where:
- **Orange nodes** are key entities (e.g., leaders, hubs) with limited but strategic connections.
- **Blue nodes** serve as intermediaries, facilitating communication or resource flow between gray nodes.
- **Gray nodes** represent peripheral or subordinate entities with fewer direct interactions.
The absence of labels suggests the diagram is a generic representation, possibly for illustrative purposes. The hierarchical structure implies a system where central nodes (blue) maintain cohesion, while peripheral nodes (orange) drive external interactions. Outliers include the isolated orange nodes, which may represent specialized roles or bottlenecks.
### Limitations
- No textual data or legends prevent precise identification of nodes or relationships.
- Assumptions about node roles are based on visual patterns and common network theory.
**Note**: The image contains no textual information, axis labels, or legends. All interpretations are derived from visual patterns and network theory principles.