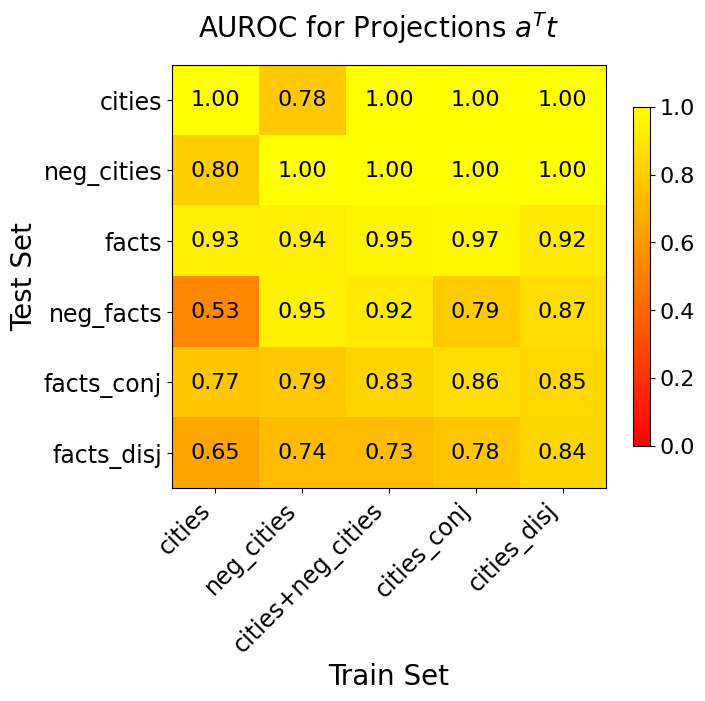
## Heatmap: AUROC for Projections a^Tt
### Overview
The image is a heatmap visualizing the Area Under the Receiver Operating Characteristic curve (AUROC) for different combinations of training and test sets. The matrix compares six test sets against five training sets, with values ranging from 0.0 to 1.0 (red to yellow). The diagonal shows perfect agreement (1.00) when test and train sets match, while off-diagonal values indicate performance degradation.
### Components/Axes
- **Title**: "AUROC for Projections a^Tt" (top center)
- **Rows (Test Sets)**:
- cities
- neg_cities
- facts
- neg_facts
- facts_conj
- facts_disl
- **Columns (Train Sets)**:
- cities
- neg_cities
- cities+neg_cities
- cities_conj
- cities_disl
- **Legend**: Vertical colorbar on the right, labeled "0.0" (red) to "1.0" (yellow)
- **Axis Labels**:
- X-axis: "Train Set" (bottom center)
- Y-axis: "Test Set" (left side)
### Detailed Analysis
- **Diagonal Values**: All diagonal cells (e.g., cities vs cities, neg_cities vs neg_cities) have AUROC = 1.00, indicating perfect performance when test and train sets align.
- **Off-Diagonal Trends**:
- **neg_facts Row**:
- cities: 0.53 (lowest value, red)
- neg_cities: 0.95
- cities+neg_cities: 0.92
- cities_conj: 0.79
- cities_disl: 0.87
- **facts Row**:
- cities: 0.93
- neg_cities: 0.94
- cities+neg_cities: 0.95
- cities_conj: 0.97
- cities_disl: 0.92
- **facts_conj Row**:
- cities: 0.77
- neg_cities: 0.79
- cities+neg_cities: 0.83
- cities_conj: 0.86
- cities_disl: 0.85
- **facts_disl Row**:
- cities: 0.65
- neg_cities: 0.74
- cities+neg_cities: 0.73
- cities_conj: 0.78
- cities_disl: 0.84
### Key Observations
1. **Perfect Alignment**: Diagonal values (1.00) confirm optimal performance when test and train sets match.
2. **neg_facts Vulnerability**: The neg_facts test set shows the worst performance (0.53) when trained on cities, suggesting poor generalization to negated facts.
3. **Generalization Gaps**:
- facts_conj and facts_disl test sets perform moderately (0.65–0.85) across most train sets, indicating limited cross-set generalization.
- facts test set maintains high performance (0.92–0.97) even when trained on neg_cities or mixed sets.
4. **Color Consistency**: All values align with the legend (e.g., 0.53 = dark red, 1.00 = bright yellow).
### Interpretation
The heatmap reveals that model performance (AUROC) is maximized when training and test sets are identical, highlighting a lack of generalization across different data configurations. The neg_facts test set is particularly problematic, performing poorly when trained on cities (0.53), suggesting the model struggles with negated facts in this context. Conversely, the facts test set maintains high performance across most train sets, indicating robustness to negation in training data. The conjunction (facts_conj) and disjunction (facts_disl) test sets show intermediate performance, implying partial generalization but significant degradation compared to aligned sets. This suggests that the model’s ability to handle logical operations (conjunction/disjunction) and negation depends heavily on training data alignment, with critical failures observed in negated fact scenarios.