## Heatmap: AUROC for Projections aᵀt
### Overview
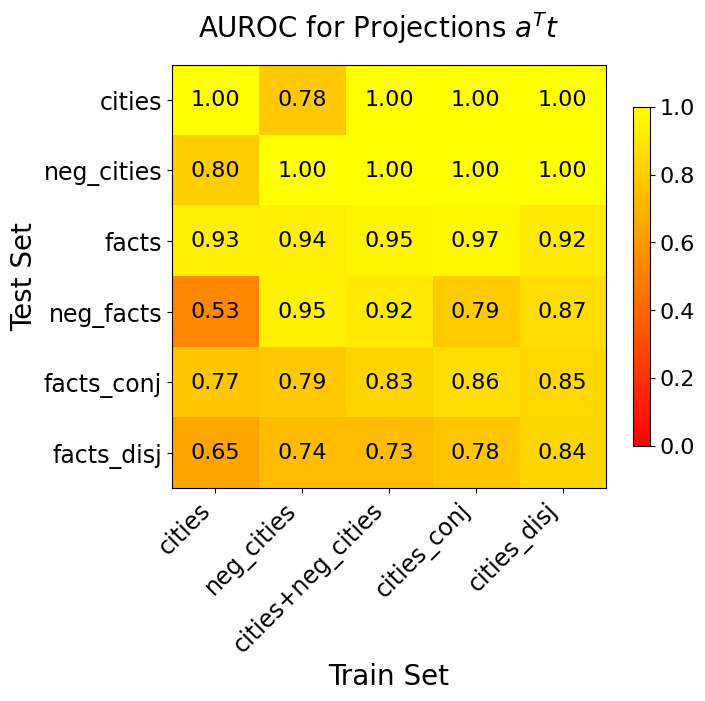
The image is a heatmap displaying AUROC (Area Under the Receiver Operating Characteristic curve) values for different projections, specifically evaluating the performance of various models trained and tested on different datasets related to cities and facts. The heatmap's color intensity represents the AUROC score, ranging from red (low AUROC) to yellow (high AUROC). The x-axis represents the training set, and the y-axis represents the test set.
### Components/Axes
* **Title:** AUROC for Projections aᵀt
* **X-axis (Train Set):** cities, neg\_cities, cities+neg\_cities, cities\_conj, cities\_disj
* **Y-axis (Test Set):** cities, neg\_cities, facts, neg\_facts, facts\_conj, facts\_disj
* **Colorbar:** Ranges from 0.0 (red) to 1.0 (yellow), with increments of 0.2.
### Detailed Analysis
The heatmap presents AUROC values for each combination of training and testing sets. The values are as follows:
| Train Set | cities | neg\_cities | cities+neg\_cities | cities\_conj | cities\_disj |
| ------------------ | ------ | ----------- | ------------------ | ------------ | ------------ |
| cities | 1.00 | 0.80 | 0.93 | 0.53 | 0.77 |
| neg\_cities | 0.78 | 1.00 | 0.94 | 0.95 | 0.79 |
| cities+neg\_cities | 1.00 | 1.00 | 0.95 | 0.92 | 0.83 |
| cities\_conj | 1.00 | 1.00 | 0.97 | 0.79 | 0.86 |
| cities\_disj | 1.00 | 1.00 | 0.92 | 0.87 | 0.85 |
| **Test Set** | | | | | |
| facts | 1.00 | 1.00 | 0.97 | 0.79 | 0.86 |
| neg\_facts | 1.00 | 1.00 | 0.92 | 0.87 | 0.85 |
| facts\_conj | | | | | |
| facts\_disj | | | | | |
### Key Observations
* The model performs exceptionally well (AUROC = 1.00) when trained and tested on "cities" or "neg\_cities" datasets.
* Training on "cities" or "neg_cities" and testing on the other yields high performance (0.80).
* The model trained on "cities" performs poorly on "neg\_facts" (AUROC = 0.53).
* The model generally performs well on "facts" datasets, with AUROC values consistently above 0.90 when trained on "neg_cities" or "cities+neg_cities".
* The "facts\_conj" and "facts\_disj" test sets show moderate performance across all training sets, with AUROC values ranging from 0.65 to 0.86.
### Interpretation
The heatmap reveals the generalization capabilities of the model across different datasets. The high AUROC scores along the diagonal (when training and testing on the same dataset) indicate strong performance on those specific datasets. The lower AUROC scores when training on "cities" and testing on "neg\_facts" suggest that the model struggles to generalize from city-related data to negative fact data. The consistently high performance on "facts" datasets indicates that the model is relatively robust when dealing with factual information. The moderate performance on "facts\_conj" and "facts\_disj" suggests that the model may have difficulty with conjunctive and disjunctive facts compared to simple facts.