## Bar Chart: Number of Basis Functions by Location and Diagonal Status
### Overview
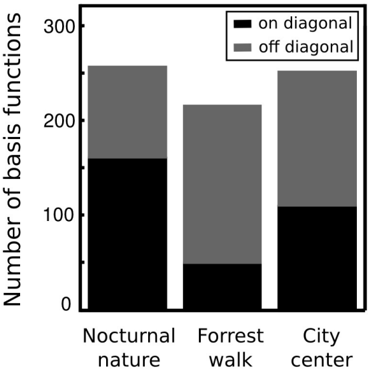
The chart compares the number of basis functions across three locations (Nocturnal nature, Forrest walk, City center) with two categories: "on diagonal" (black) and "off diagonal" (gray). The y-axis ranges from 0 to 300, and the x-axis lists the three locations.
### Components/Axes
- **X-axis**: Categories labeled "Nocturnal nature," "Forrest walk," and "City center."
- **Y-axis**: "Number of basis functions" with increments of 100.
- **Legend**: Located in the top-right corner, with black representing "on diagonal" and gray representing "off diagonal."
- **Bars**: Stacked vertically for each location, with black (on diagonal) at the bottom and gray (off diagonal) on top.
### Detailed Analysis
1. **Nocturnal nature**:
- On diagonal (black): ~160
- Off diagonal (gray): ~90
- Total: ~250
2. **Forrest walk**:
- On diagonal (black): ~50
- Off diagonal (gray): ~170
- Total: ~220
3. **City center**:
- On diagonal (black): ~110
- Off diagonal (gray): ~150
- Total: ~260
### Key Observations
- **On-diagonal dominance**: Nocturnal nature has the highest on-diagonal value (~160), while Forrest walk has the lowest (~50).
- **Off-diagonal dominance**: Forrest walk has the highest off-diagonal value (~170), exceeding its on-diagonal value by ~120.
- **Total values**: City center has the highest total (~260), followed by Nocturnal nature (~250) and Forrest walk (~220).
### Interpretation
The data suggests that the number of basis functions varies significantly by location and diagonal status. Nocturnal nature exhibits a strong on-diagonal component, potentially indicating localized or self-contained features. Forrest walk’s off-diagonal dominance implies greater interdependence between features, possibly due to environmental complexity. City center balances both categories but has the highest total, suggesting a mix of localized and interconnected features. The stark contrast in on-diagonal values between locations highlights differing structural properties in their respective environments.