# Technical Document Extraction: Graphene Quantum Dot (GQD) Electronic Structure
## Diagram Overview
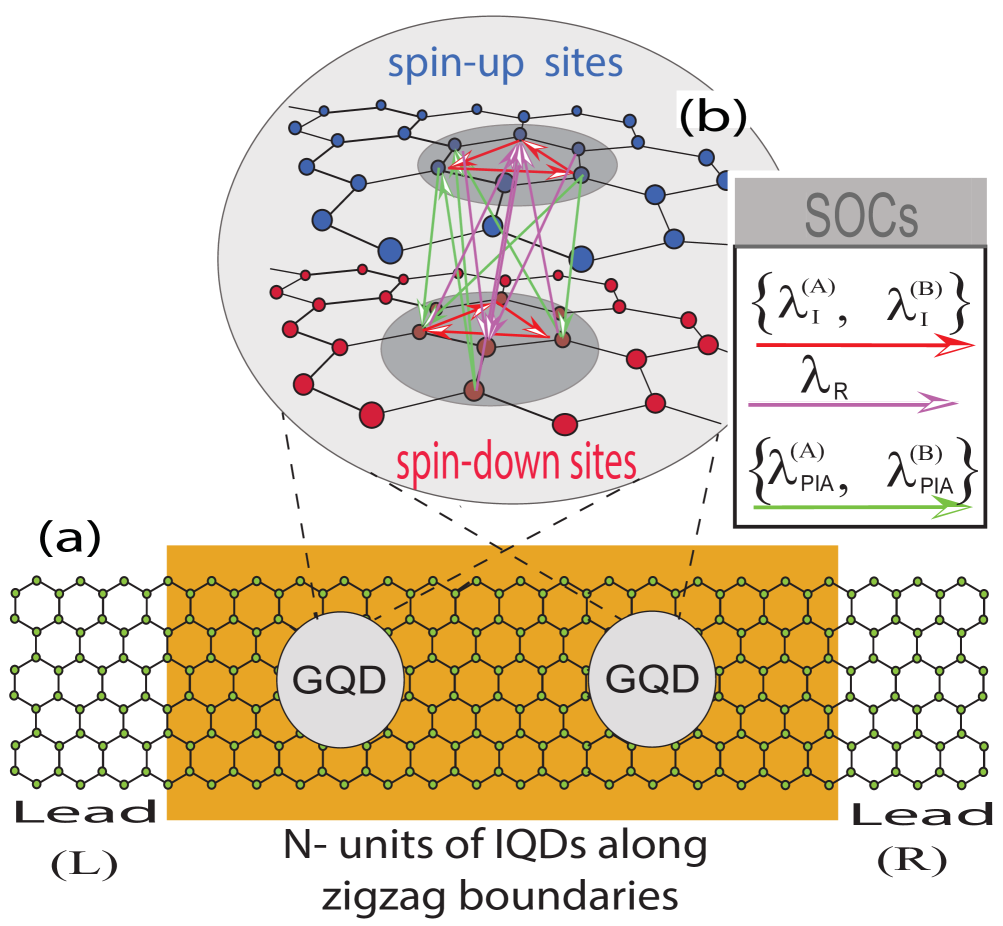
The image depicts a hybrid system combining graphene quantum dots (GQDs) with leads and spin-dependent electronic interactions. Key components are labeled and color-coded for clarity.
---
### **Part (a): GQD System Schematic**
#### **Components**
- **Leads**:
- Left Lead (L): Green hexagonal lattice structure.
- Right Lead (R): Green hexagonal lattice structure.
- **Graphene Quantum Dots (GQDs)**:
- Two central GQDs (orange circles) connected by zigzag boundaries.
- Labeled as "N- units of IQDs along zigzag boundaries" between leads.
- **Spin States**:
- **Spin-up sites**: Blue nodes.
- **Spin-down sites**: Red nodes.
- **Connections**:
- Green, purple, and red lines represent spin-dependent interactions (see Part b legend).
---
### **Part (b): Electronic Structure (SOCs)**
#### **Legend: Spin-Orbit Coupling (SOC) Transitions**
| **Transition** | **Color** | **Direction** |
|-------------------------------|-----------|-----------------------------------|
| {λ_I^(A), λ_I^(B)} → λ_R | Red | ↑ (Vertical) |
| λ_R → {λ_PIA^(A), λ_PIA^(B)} | Purple | ↓ (Vertical) |
| {λ_I^(A), λ_I^(B)} ↔ {λ_PIA^(A), λ_PIA^(B)} | Green | ↔ (Horizontal) |
#### **Key Observations**
1. **Spin-Orbit Coupling (SOC)**:
- Spin-up (blue) and spin-down (red) sites are interconnected via SOCs.
- Transitions between spin states are mediated by λ_R (purple) and λ_PIA (green).
2. **Energy States**:
- λ_I^(A/B): Initial spin-up/down states.
- λ_R: Intermediate state enabling spin-flip transitions.
- λ_PIA^(A/B): Final spin-up/down states post-SOC interaction.
---
### **Cross-Referenced Diagram Details**
- **Color Consistency**:
- Red arrows in the legend correspond to vertical transitions between spin-up/down states.
- Purple arrows represent λ_R-mediated spin-flip processes.
- Green arrows indicate horizontal coupling between λ_I and λ_PIA states.
- **Structural Flow**:
- Spin-up/down sites (blue/red) are interconnected via zigzag boundaries in the GQD lattice.
- Leads (L/R) act as reservoirs for electron transport, with SOCs modulating spin-dependent pathways.
---
### **Summary**
The diagram illustrates a GQD-based system where spin-orbit coupling (SOC) governs transitions between spin-up and spin-down electronic states. The legend explicitly defines SOC-mediated pathways, with color-coded arrows mapping transitions between λ_I, λ_R, and λ_PIA states. This system is embedded within a graphene lattice connected to leads, enabling controlled spin-dependent transport.