## Area Chart: Proportion of Successful Rebuilds Over Time
### Overview
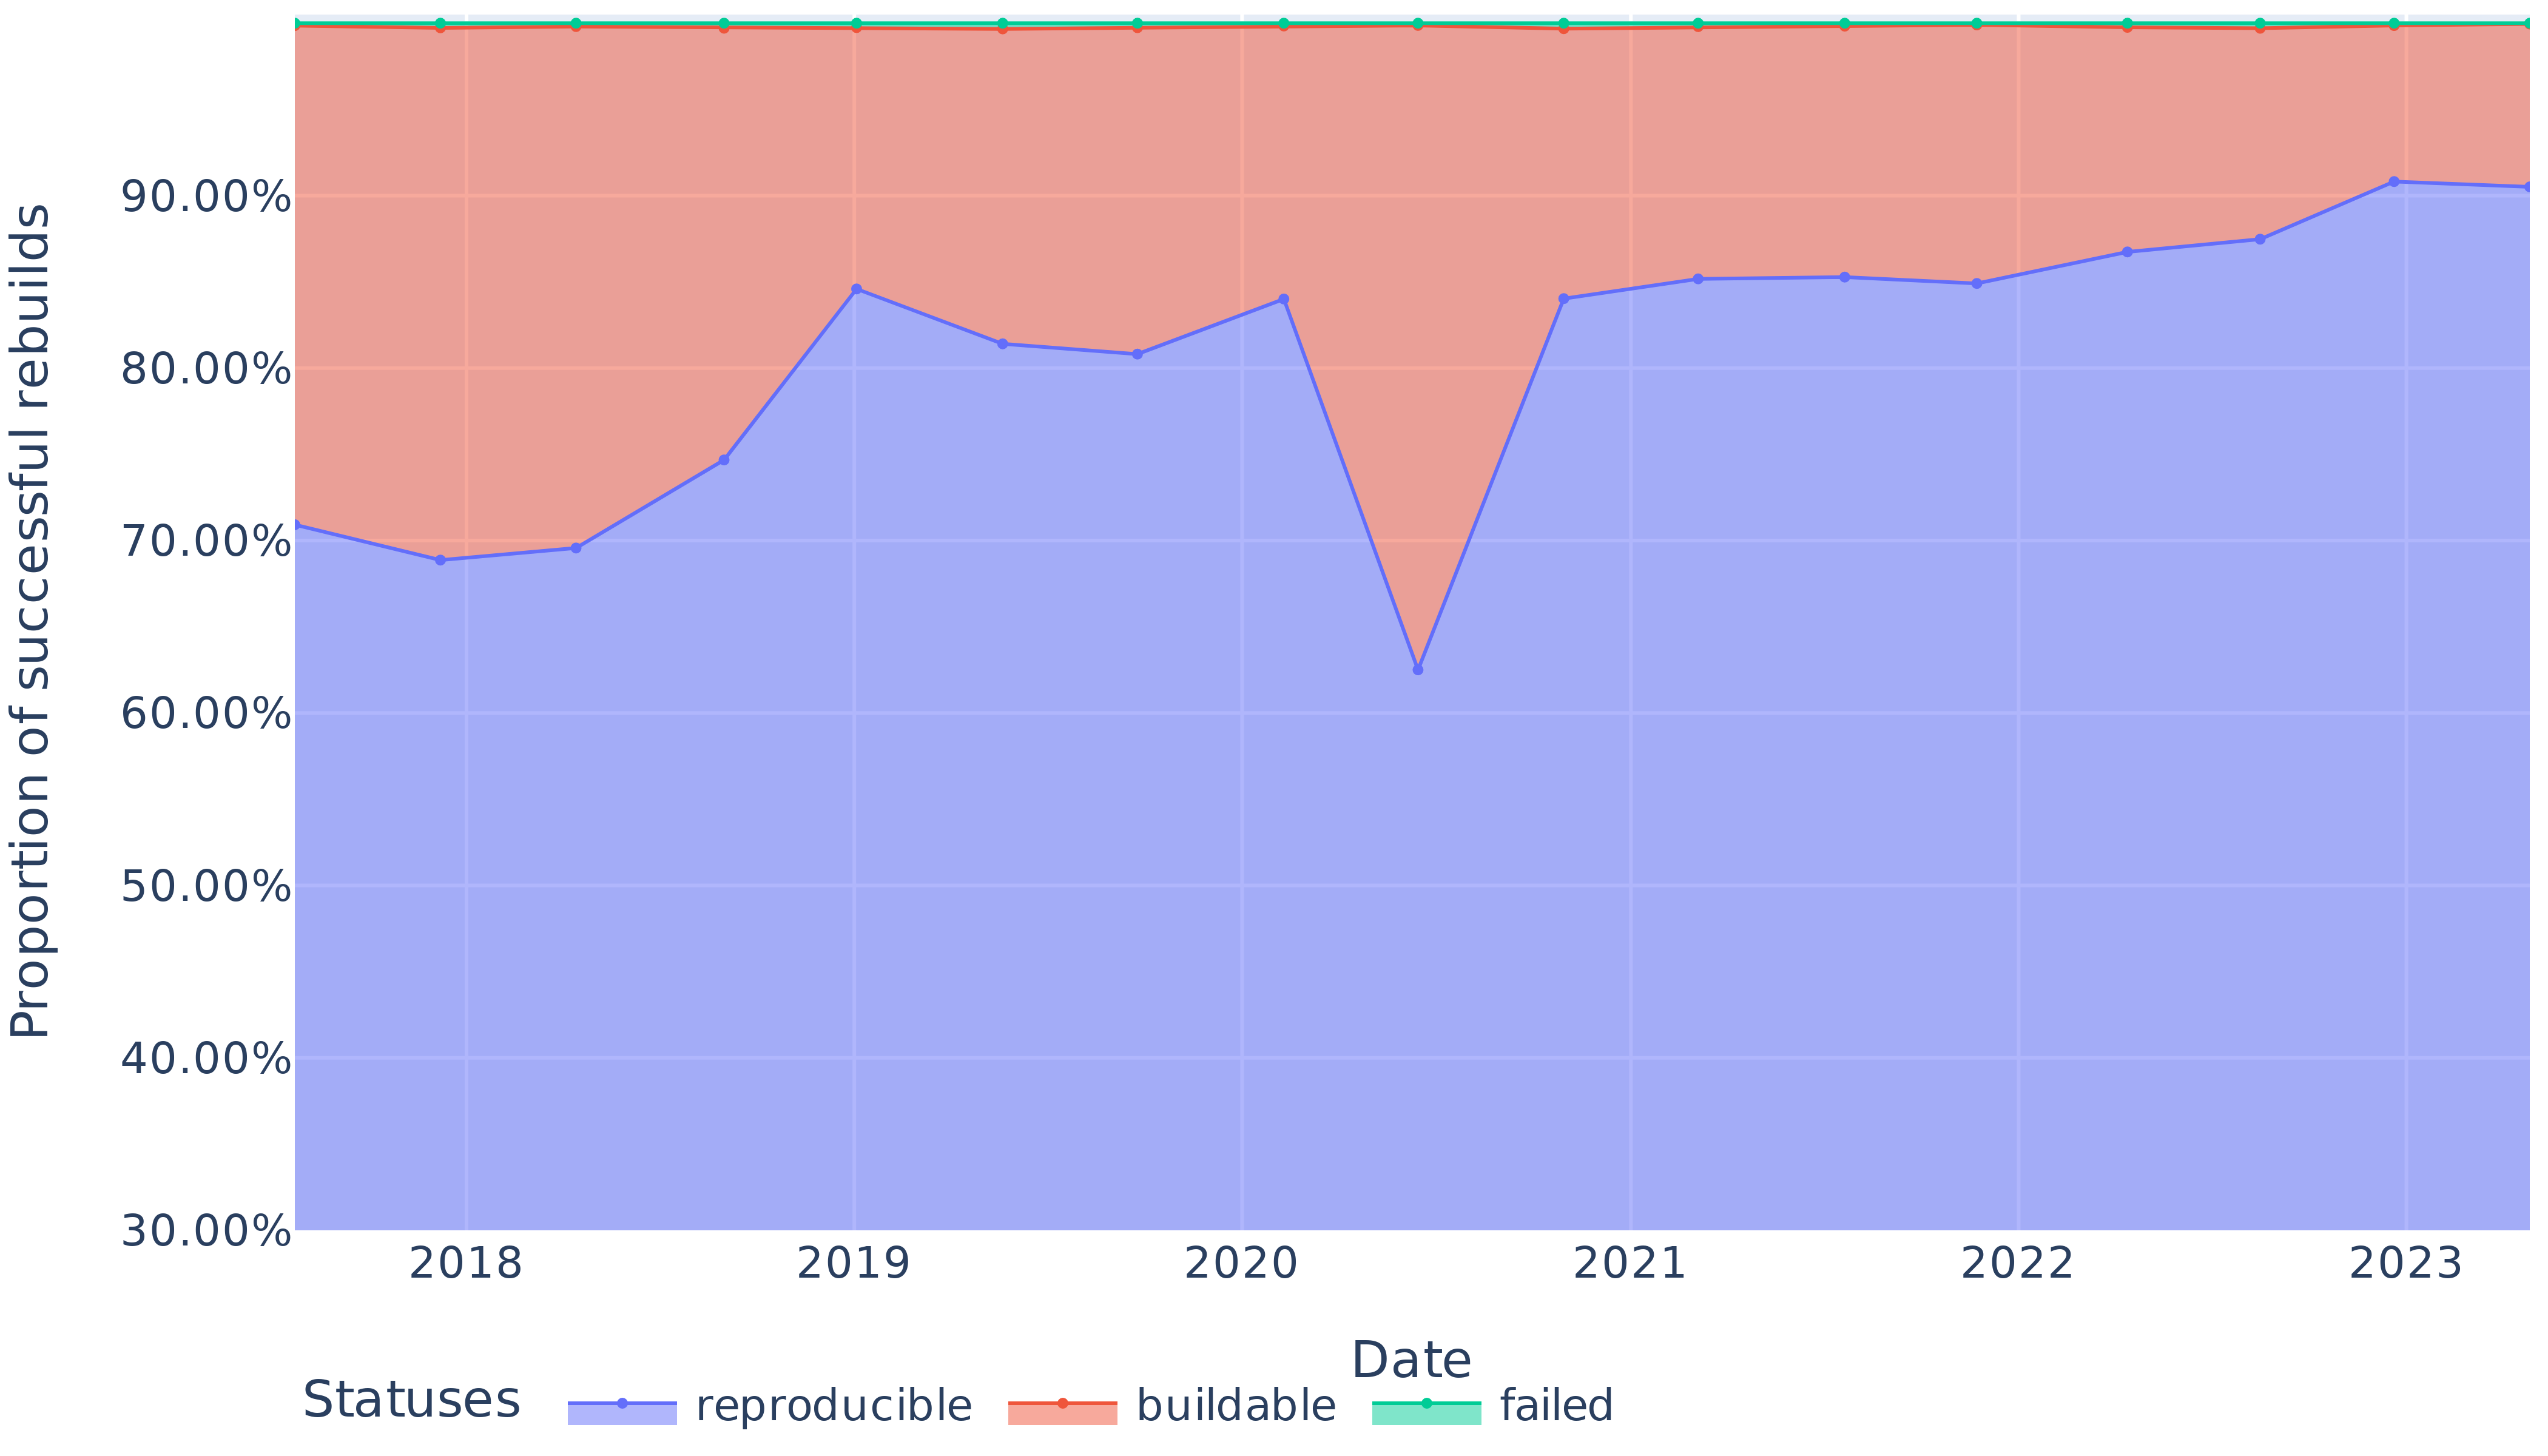
The image is an area chart showing the proportion of successful rebuilds over time, broken down by status: reproducible, buildable, and failed. The x-axis represents the date from 2018 to 2023, and the y-axis represents the proportion of successful rebuilds, ranging from 30.00% to 90.00%.
### Components/Axes
* **Title:** None
* **X-axis:**
* **Label:** Date
* **Scale:** 2018, 2019, 2020, 2021, 2022, 2023
* **Y-axis:**
* **Label:** Proportion of successful rebuilds
* **Scale:** 30.00%, 40.00%, 50.00%, 60.00%, 70.00%, 80.00%, 90.00%
* **Legend:** Located at the bottom of the chart.
* **Statuses:**
* Reproducible (light blue)
* Buildable (light red)
* Failed (light green)
### Detailed Analysis
* **Reproducible (light blue):** The proportion of reproducible rebuilds starts at approximately 70.00% in 2018, dips slightly to around 69.00% in early 2018, then increases to approximately 85.00% by 2019. It then decreases to approximately 81.00% in 2020, then dips sharply to approximately 62.00% in late 2020. It then increases to approximately 85.00% in 2021, and remains relatively stable at approximately 85.00% in 2022, before increasing to approximately 91.00% in 2023.
* **Buildable (light red):** The proportion of buildable rebuilds remains relatively constant at approximately 98.00% throughout the entire period from 2018 to 2023.
* **Failed (light green):** The proportion of failed rebuilds remains relatively constant at approximately 99.00% throughout the entire period from 2018 to 2023.
### Key Observations
* The proportion of reproducible rebuilds fluctuates more significantly than the other two categories.
* The proportion of buildable and failed rebuilds remains relatively stable over the entire period.
* There is a notable dip in the proportion of reproducible rebuilds around 2020.
### Interpretation
The chart indicates that the reproducibility of rebuilds has varied over time, with a notable dip around 2020. The buildable and failed statuses have remained relatively consistent, suggesting that these aspects of the rebuild process are more stable. The increase in reproducible rebuilds in 2023 suggests an improvement in the reproducibility of the rebuild process. The relationship between the statuses shows that the majority of rebuilds are buildable, with a smaller proportion being reproducible, and an even smaller proportion failing. The dip in reproducibility around 2020 could be due to changes in the build environment, dependencies, or other factors that affect reproducibility.