\n
## Line Chart: Proportion of Successful Rebuilds Over Time
### Overview
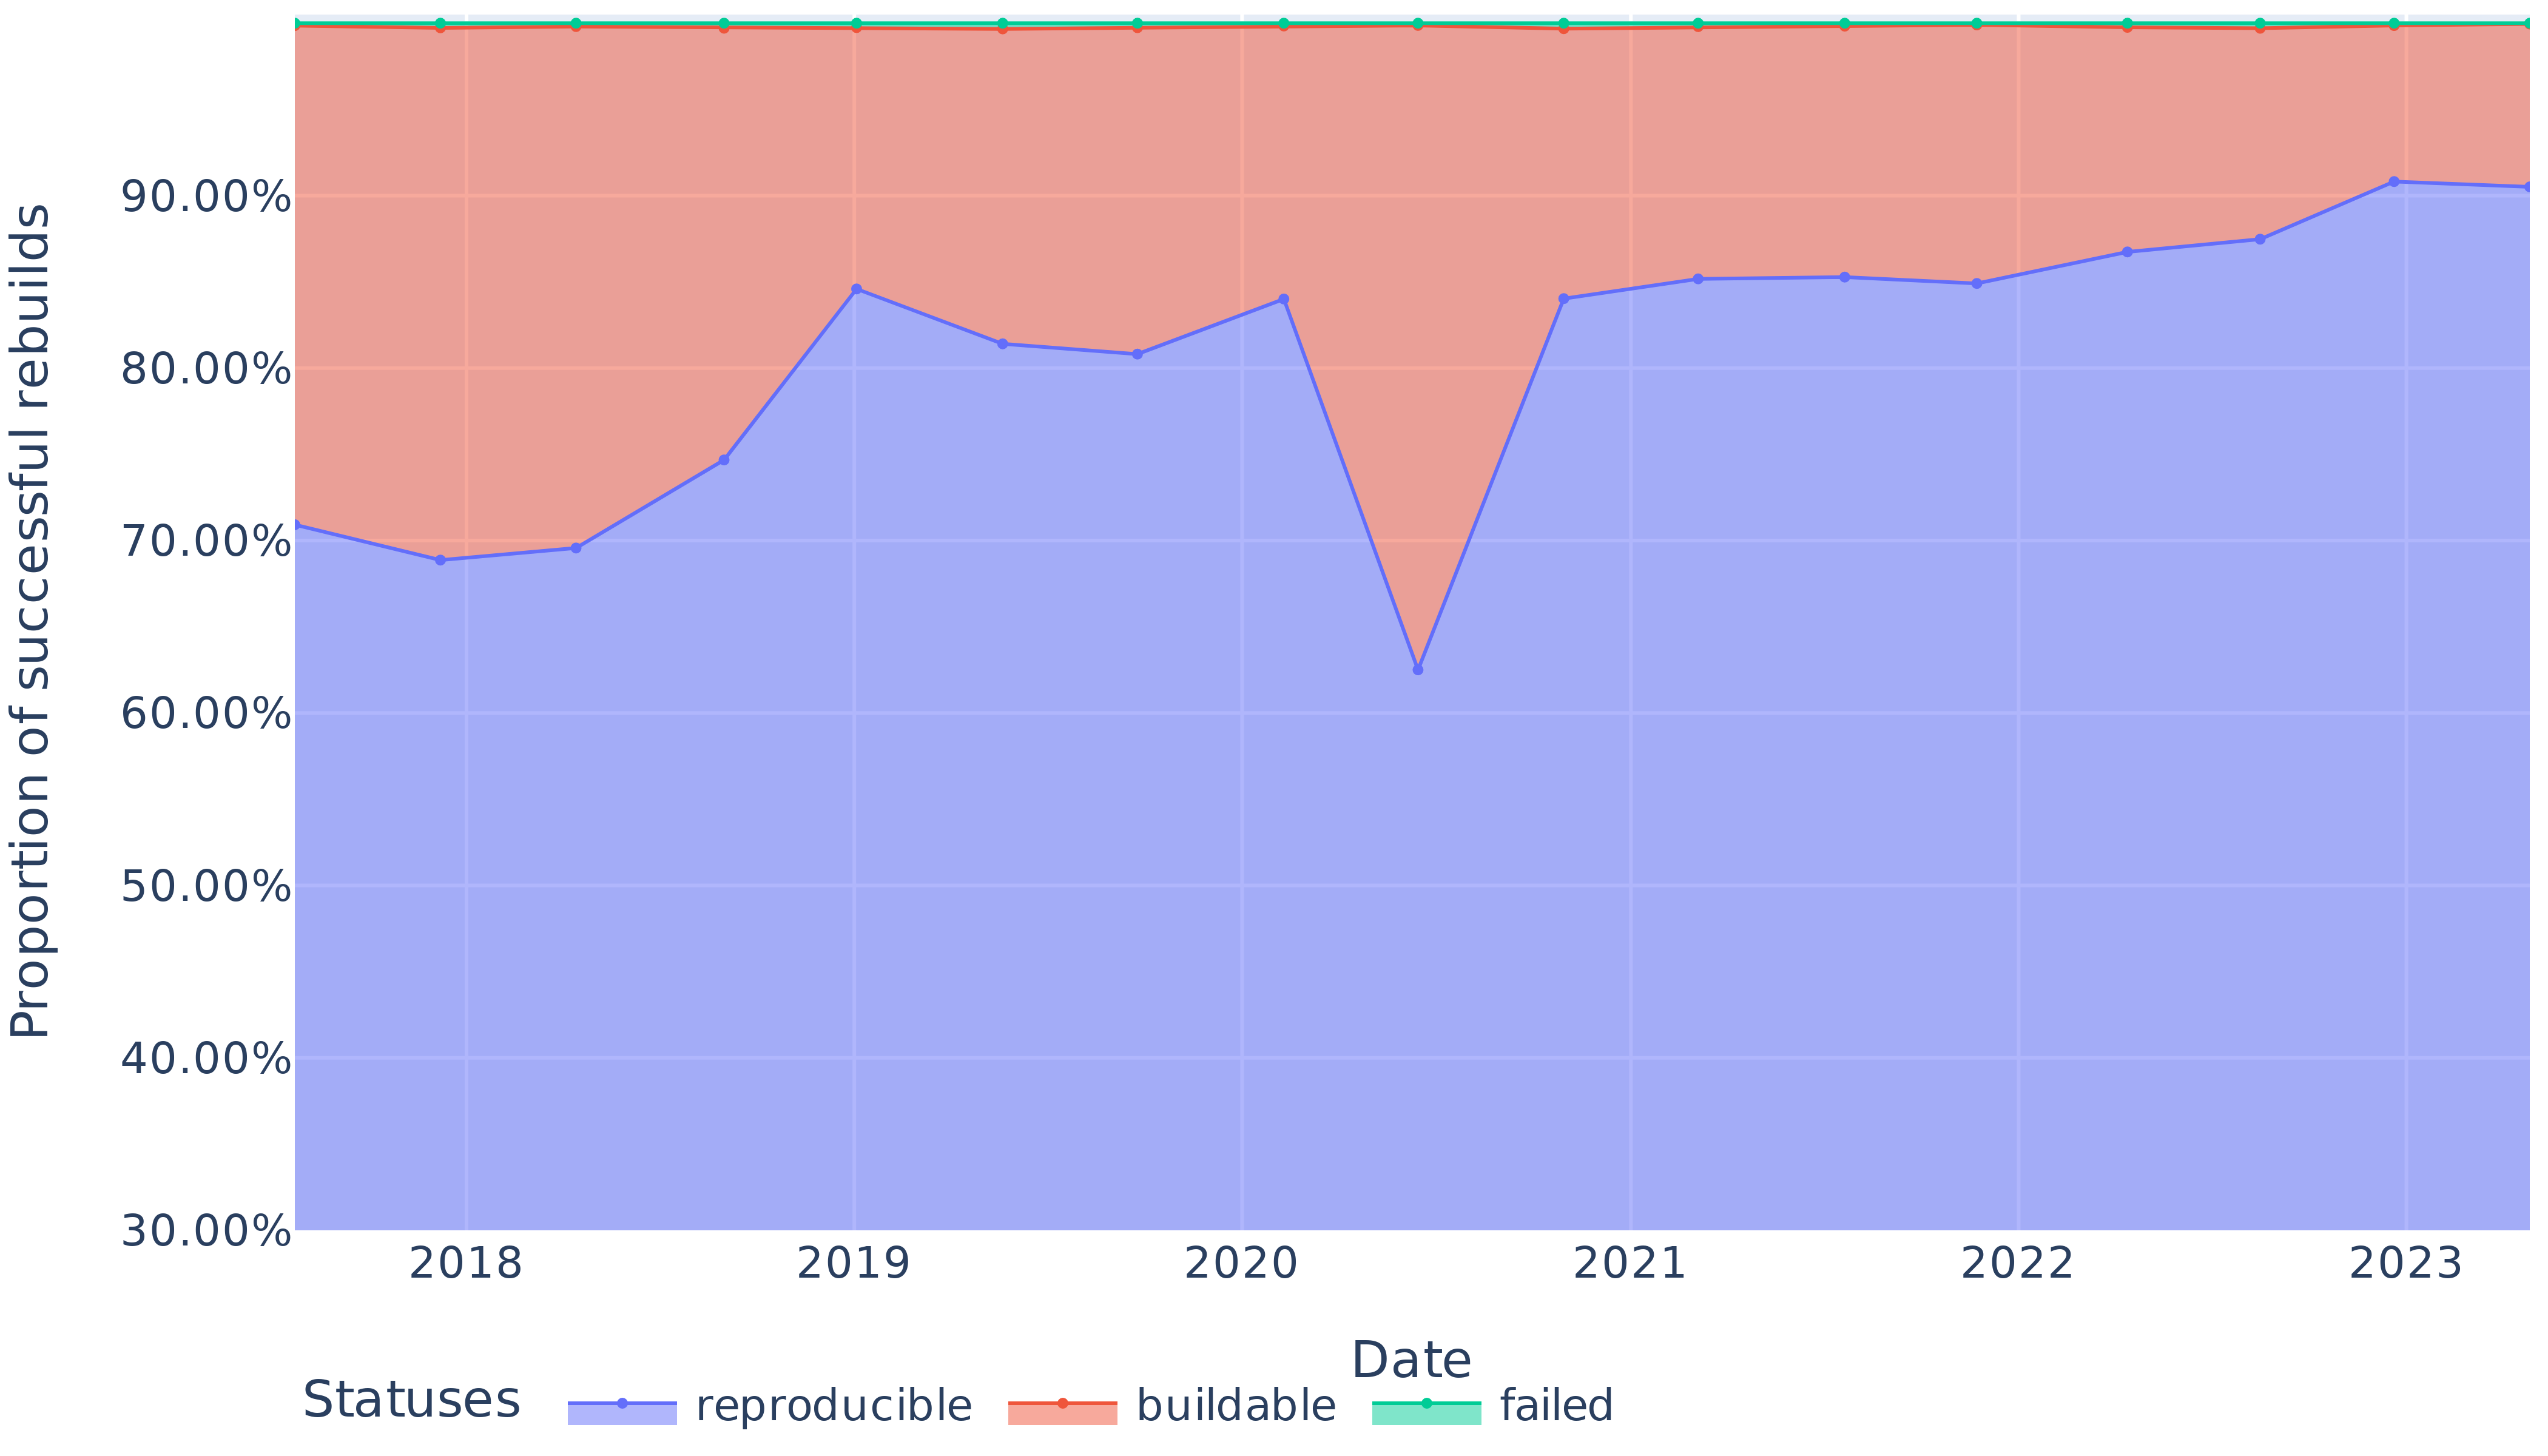
This line chart displays the proportion of successful rebuilds (categorized as 'reproducible', 'buildable', and 'failed') over the years 2018 to 2023. The y-axis represents the proportion of successful rebuilds, ranging from 30% to 100%, while the x-axis represents the date, spanning from 2018 to 2023. The chart uses three distinct colored lines to represent each status category.
### Components/Axes
* **X-axis Title:** Date
* **Y-axis Title:** Proportion of successful rebuilds
* **Legend:** Located at the bottom-left corner of the chart.
* **Reproducible:** Blue line
* **Buildable:** Orange line
* **Failed:** Red line
* **X-axis Markers:** 2018, 2019, 2020, 2021, 2022, 2023
* **Y-axis Markers:** 30.00%, 40.00%, 50.00%, 60.00%, 70.00%, 80.00%, 90.00%, 100.00%
### Detailed Analysis
* **Reproducible (Blue Line):** The blue line representing 'reproducible' rebuilds starts at approximately 71% in 2018. It generally slopes upward, reaching around 76% in 2019, then increases to approximately 83% in 2020. It dips to around 80% in 2021, then rises to approximately 86% in 2022, and finally reaches approximately 91% in 2023.
* **Buildable (Orange Line):** The orange line representing 'buildable' rebuilds starts at approximately 72% in 2018. It increases to around 86% in 2019, then drops sharply to approximately 64% in 2020. It recovers to around 84% in 2021, then increases to approximately 88% in 2022, and finally reaches approximately 92% in 2023.
* **Failed (Red Line):** The red line representing 'failed' rebuilds starts at approximately 100% in 2018. It decreases to around 86% in 2019, then drops to approximately 78% in 2020. It increases to around 82% in 2021, then decreases to approximately 80% in 2022, and finally reaches approximately 78% in 2023.
### Key Observations
* The 'failed' rebuilds consistently have the highest proportion among the three categories, although it decreases over time.
* The 'reproducible' and 'buildable' rebuilds show a generally increasing trend over the years, with some fluctuations.
* The most significant drop in 'buildable' rebuilds occurs in 2020, followed by a recovery in subsequent years.
* The 'reproducible' line is consistently lower than the 'buildable' line.
### Interpretation
The data suggests a general improvement in the success rate of rebuilds over the period 2018-2023. The decreasing trend in 'failed' rebuilds indicates that the build process is becoming more reliable. The fluctuations observed in the 'reproducible' and 'buildable' lines could be attributed to changes in the codebase, build environment, or testing procedures. The sharp drop in 'buildable' rebuilds in 2020 warrants further investigation to identify the root cause. The consistent difference between 'reproducible' and 'buildable' suggests that while builds are generally successful, ensuring reproducibility remains a challenge. The overall trend indicates a positive direction in build reliability and quality.