## Line Chart: Proportion of Successful Rebuilds Over Time (2018–2023)
### Overview
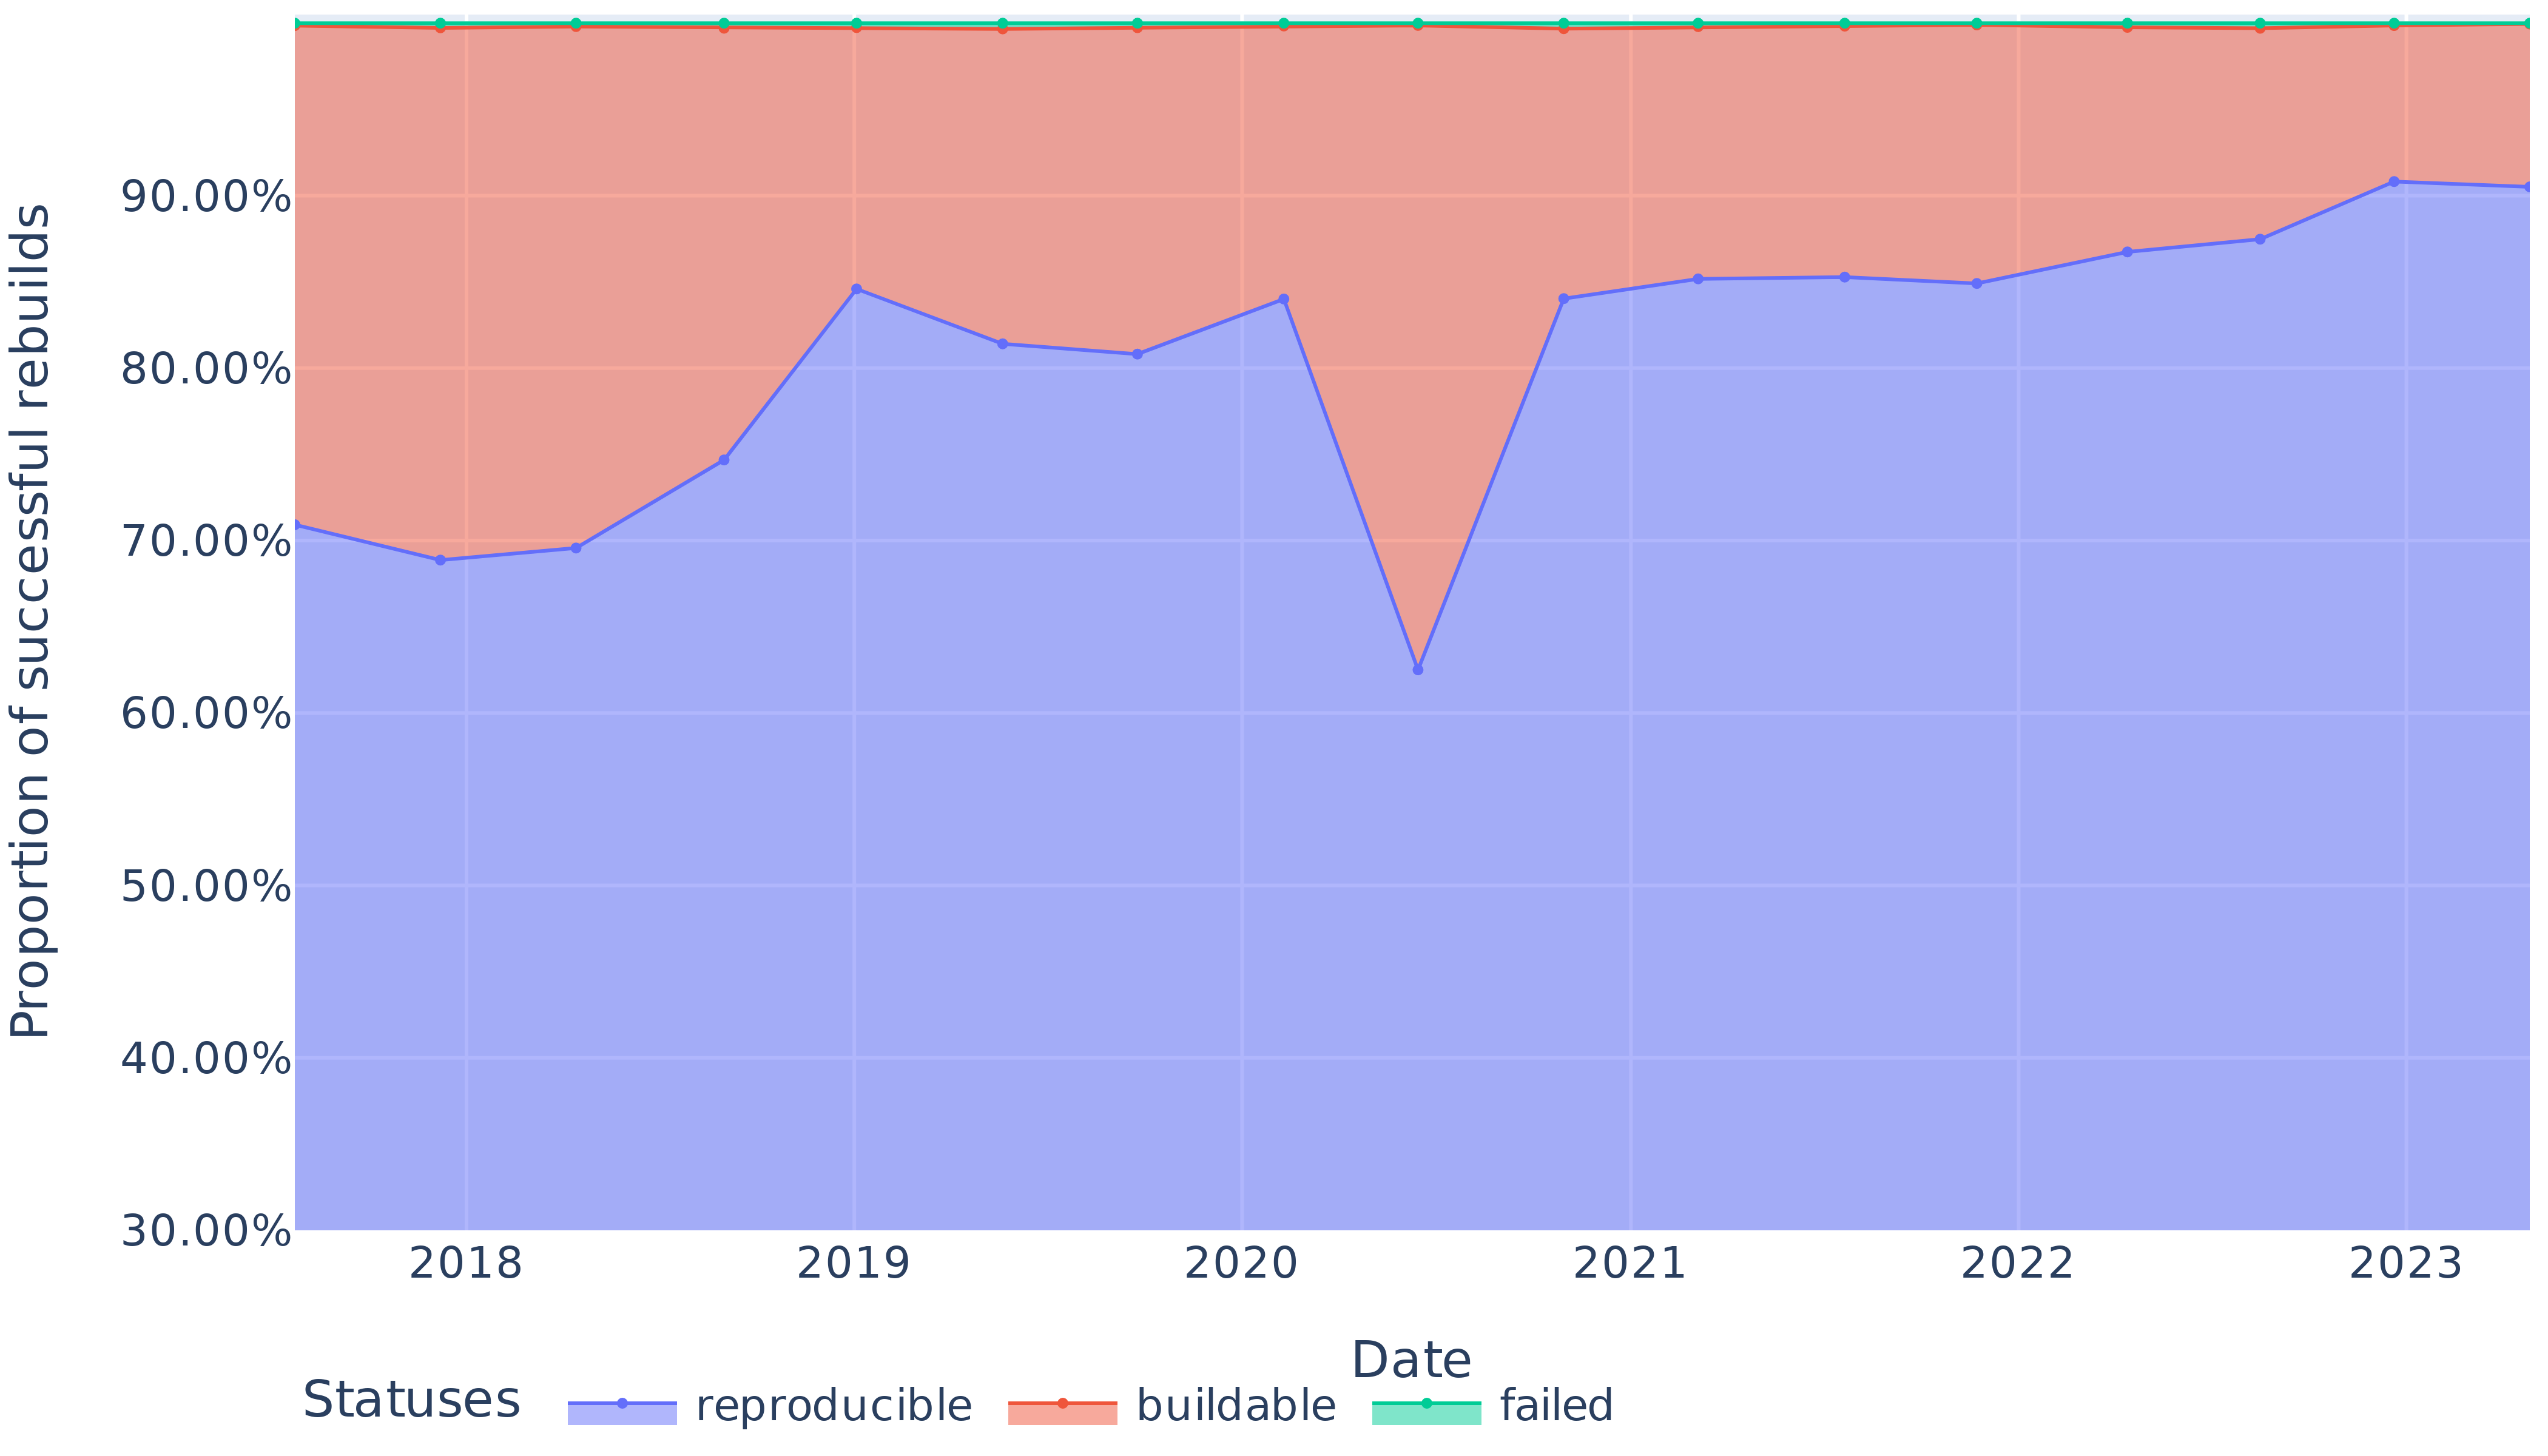
The chart visualizes the proportion of successful rebuilds categorized by three statuses: **reproducible** (blue), **buildable** (red), and **failed** (green). Data spans from 2018 to 2023, with the y-axis representing the proportion of successful rebuilds as a percentage (30%–90%). The failed status consistently dominates, while reproducible rebuilds show the most variability.
---
### Components/Axes
- **X-axis (Date)**: Years 2018–2023, labeled at annual intervals.
- **Y-axis (Proportion of successful rebuilds)**: Percentage scale from 30% to 90%, with gridlines at 10% intervals.
- **Legend**: Located at the bottom, mapping:
- **Blue**: Reproducible rebuilds
- **Red**: Buildable rebuilds
- **Green**: Failed rebuilds
- **Data Representation**: Lines with markers (dots) for each status.
---
### Detailed Analysis
1. **Failed Rebuilds (Green)**:
- **Trend**: Nearly flat line at **~99%** across all years.
- **Values**:
- 2018: 99%
- 2019: 99%
- 2020: 99%
- 2021: 99%
- 2022: 99%
- 2023: 99%
2. **Buildable Rebuilds (Red)**:
- **Trend**: Stable with minor fluctuations, starting at ~90% and ending at ~91%.
- **Values**:
- 2018: 90%
- 2019: 90%
- 2020: 88%
- 2021: 90%
- 2022: 90%
- 2023: 91%
3. **Reproducible Rebuilds (Blue)**:
- **Trend**: Significant variability, starting at 70%, peaking at 90% in 2023, with a sharp dip in 2020.
- **Values**:
- 2018: 70%
- 2019: 85%
- 2020: 62%
- 2021: 84%
- 2022: 85%
- 2023: 90%
---
### Key Observations
1. **Failed Rebuilds Dominance**: The green line remains at **~99%** throughout, indicating that nearly all rebuilds fail to meet the highest standard.
2. **Reproducible Rebuilds Volatility**:
- Sharp decline in 2020 (**62%**) suggests a temporary systemic issue.
- Recovery to **90% in 2023** indicates improved reproducibility post-2020.
3. **Buildable Stability**: The red line shows minimal change, hovering around **90%**, suggesting consistent mid-tier rebuild success.
4. **Color Consistency**: All data points match the legend (blue = reproducible, red = buildable, green = failed).
---
### Interpretation
- **Systemic Challenges**: The persistent **99% failure rate** implies unresolved issues in rebuild processes, possibly due to technical debt or resource constraints.
- **Reproducibility Recovery**: The rebound in reproducible rebuilds post-2020 suggests targeted improvements (e.g., process optimization, tooling upgrades).
- **Buildable Plateau**: The stable buildable rate may reflect a baseline threshold for acceptable rebuilds, with limited room for growth.
- **2020 Anomaly**: The dip in reproducible rebuilds could correlate with external factors (e.g., global disruptions, resource reallocation) or internal bottlenecks.
---
### Spatial Grounding
- **Legend**: Bottom-center, clearly aligned with line colors.
- **Data Points**: Markers (dots) placed directly on lines, ensuring visual clarity.
- **Axis Labels**: Positioned at the ends of axes, with gridlines aiding readability.
---
### Content Details
- **Y-axis Scale**: Starts at 30% (unlabeled lower bound) to 90% (upper bound), with 10% increments.
- **X-axis Labels**: Annual ticks (2018–2023), no intermediate years shown.
- **Line Smoothness**: Lines are continuous, with no breaks, indicating no missing data.
---
### Final Notes
The chart highlights a critical imbalance: while most rebuilds fail, reproducible rebuilds have shown resilience and improvement, particularly after 2020. The buildable category remains stagnant, suggesting a need for innovation to elevate rebuild quality beyond basic functionality.