## Flowchart: LLM-Based Question Answering Process
### Overview
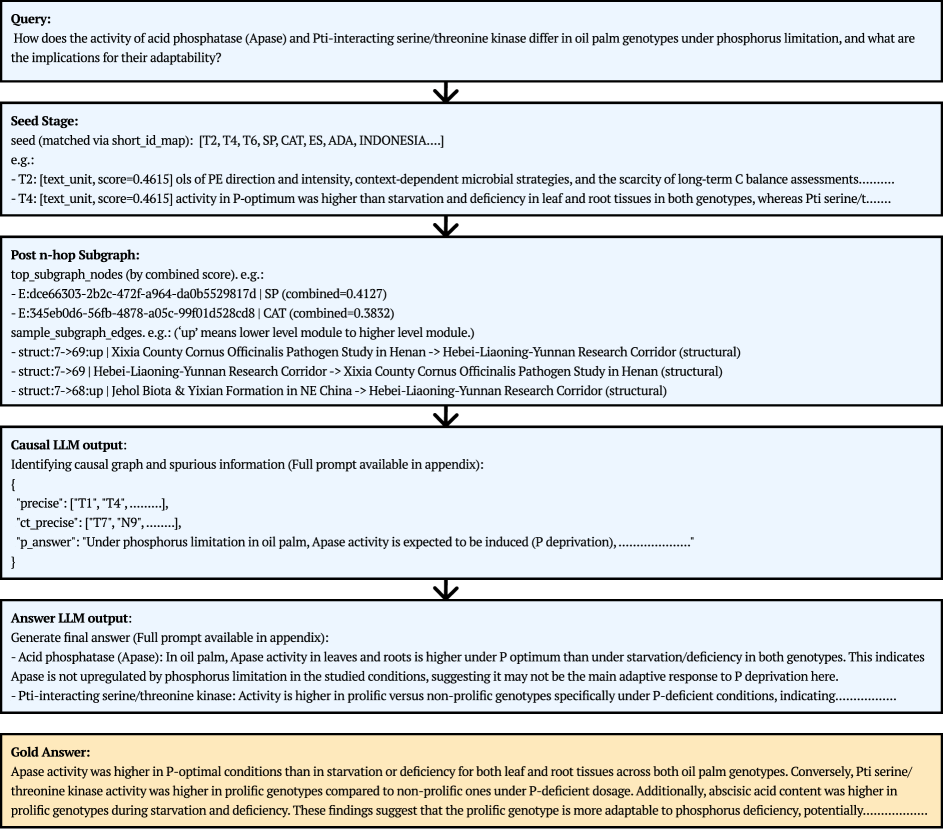
The image depicts a flowchart outlining the steps in a Language Model (LLM)-based question answering process. It starts with a query and progresses through several stages, including seed stage, subgraph extraction, causal LLM output, answer generation, and finally, a gold answer. Each stage involves specific processing and information retrieval steps.
### Components/Axes
The flowchart consists of the following components:
1. **Query:** The initial question posed to the system.
2. **Seed Stage:** Matching seeds based on a short ID map.
3. **Post n-hop Subgraph:** Extraction of relevant subgraphs.
4. **Causal LLM output:** Identification of causal graphs and spurious information.
5. **Answer LLM output:** Generation of the final answer.
6. **Gold Answer:** The reference or ideal answer.
Each stage is represented by a rectangular box with text describing the process. Arrows indicate the flow of information from one stage to the next.
### Detailed Analysis or ### Content Details
**1. Query:**
* Text: "How does the activity of acid phosphatase (Apase) and Pti-interacting serine/threonine kinase differ in oil palm genotypes under phosphorus limitation, and what are the implications for their adaptability?"
**2. Seed Stage:**
* Description: Seed matching via short\_id\_map.
* Seeds: \[T2, T4, T6, SP, CAT, ES, ADA, INDONESIA....]
* Examples:
* T2: \[text\_unit, score=0.4615] ols of PE direction and intensity, context-dependent microbial strategies, and the scarcity of long-term C balance assessments...
* T4: \[text\_unit, score=0.4615] activity in P-optimum was higher than starvation and deficiency in leaf and root tissues in both genotypes, whereas Pti serine/t.......
**3. Post n-hop Subgraph:**
* Description: Top subgraph nodes (by combined score).
* Examples:
* E:dce66303-2b2c-472f-a964-da0b5529817d | SP (combined=0.4127)
* E:345eb0d6-56fb-4878-a05c-99f01d528cd8 | CAT (combined=0.3832)
* Sample subgraph edges: ('up' means lower level module to higher level module.)
* struct:7->69:up | Xixia County Cornus Officinalis Pathogen Study in Henan -> Hebei-Liaoning-Yunnan Research Corridor (structural)
* struct:7->69 | Hebei-Liaoning-Yunnan Research Corridor -> Xixia County Cornus Officinalis Pathogen Study in Henan (structural)
* struct:7->68:up | Jehol Biota & Yixian Formation in NE China -> Hebei-Liaoning-Yunnan Research Corridor (structural)
**4. Causal LLM output:**
* Description: Identifying causal graph and spurious information (Full prompt available in appendix).
* Content:
* "precise": \["T1", "T4",.........],
* "ct\_precise": \["T7", "N9", ........],
* "p\_answer": "Under phosphorus limitation in oil palm, Apase activity is expected to be induced (P deprivation), ...................."
**5. Answer LLM output:**
* Description: Generate final answer (Full prompt available in appendix).
* Content:
* Acid phosphatase (Apase): In oil palm, Apase activity in leaves and roots is higher under P optimum than under starvation/deficiency in both genotypes. This indicates Apase is not upregulated by phosphorus limitation in the studied conditions, suggesting it may not be the main adaptive response to P deprivation here.
* Pti-interacting serine/threonine kinase: Activity is higher in prolific versus non-prolific genotypes specifically under P-deficient conditions, indicating...
**6. Gold Answer:**
* Text: Apase activity was higher in P-optimal conditions than in starvation or deficiency for both leaf and root tissues across both oil palm genotypes. Conversely, Pti serine/threonine kinase activity was higher in prolific genotypes compared to non-prolific ones under P-deficient dosage. Additionally, abscisic acid content was higher in prolific genotypes during starvation and deficiency. These findings suggest that the prolific genotype is more adaptable to phosphorus deficiency, potentially.
### Key Observations
* The process starts with a complex query about the activity of acid phosphatase and Pti-interacting serine/threonine kinase in oil palm genotypes under phosphorus limitation.
* The seed stage uses a short ID map to identify relevant seeds.
* The post n-hop subgraph stage extracts subgraphs based on combined scores.
* The causal LLM output identifies causal graphs and spurious information.
* The answer LLM output generates a final answer based on the processed information.
* The gold answer provides a reference or ideal answer for comparison.
### Interpretation
The flowchart illustrates a multi-stage process for answering a complex biological question using LLMs. The process involves identifying relevant information, extracting subgraphs, identifying causal relationships, and generating a final answer. The inclusion of a "gold answer" suggests a benchmark or reference point for evaluating the performance of the LLM-based question answering system. The process highlights the complexity of using LLMs to answer scientific questions and the need for multiple stages of processing and analysis.