\n
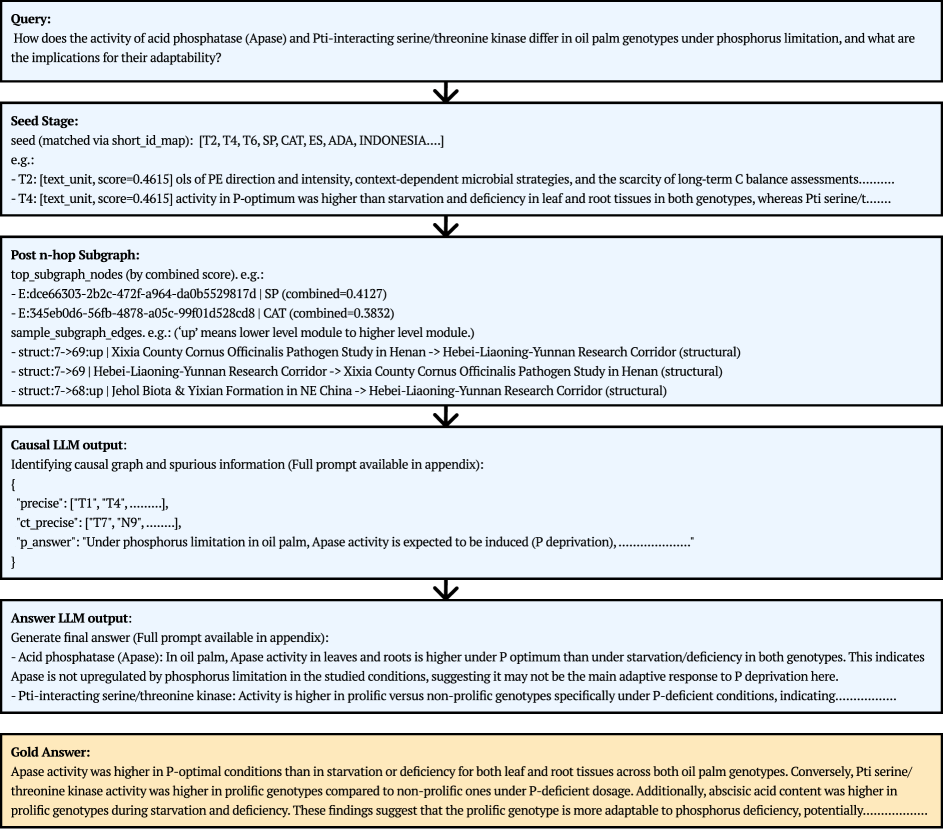
## Diagram: Research Process Flow - Palm Oil Adaptability
### Overview
This diagram illustrates a research process flow investigating the activity of acid phosphatase (Apase) and Pti-interacting serine/threonine kinase in oil palm genotypes under phosphorus limitation. The diagram depicts a query, stages of seed matching, post-hop subgraph analysis, causal LLM output, answer LLM output, and a gold answer. The flow is represented with downward arrows indicating progression.
### Components/Axes
The diagram is structured into several distinct blocks, arranged vertically. These blocks are:
1. **Query:** The initial research question.
2. **Seed Stage:** Matched seed IDs: [T1, T2, T3, T4, T5, T6, CAT, ES, ADA, INDONESIA...].
3. **Post n-Hop Subgraph:** Analysis of subgraph nodes and edges.
4. **Causal LLM output:** Precision and parameter settings.
5. **Answer LLM output:** Full prompt available in appendix.
6. **Gold Answer:** Summary of key findings.
There are no explicit axes in this diagram, but the vertical arrangement implies a temporal or sequential flow.
### Detailed Analysis or Content Details
**1. Query:**
"How does the activity of acid phosphatase (Apase) and Pti-interacting serine/threonine kinase differ in oil palm genotypes under phosphorus limitation, and what are the implications for their adaptability?"
**2. Seed Stage:**
* `seed (matched via short_id)`: [T1, T2, T3, T4, T5, T6, CAT, ES, ADA, INDONESIA...]
* `T2`: `[text_unit, score=0.4615] ols of PE direction and intensity, context-dependent microbial strategies, and the scarcity of long-term C balance assessments...`
* `T4`: `[text_unit, score=0.4615] activity in P-optimum was higher than starvation and deficiency in leaf and root tissues in both genotypes, whereas Pti serine/t...`
**3. Post n-Hop Subgraph:**
* `top_subgraph_nodes (by combined score), e.g.:`
* `E:idce66303-2b2c-472f-a964-da8b5529817d [SP (combined=0.4127)]`
* `E:345eb0d6-56fb-4878-a95c-99f01d28ce0d [CAT (combined=0.3832)]`
* `sample_subgraph_edges, e.g.:` `(up means lower level module to higher level module)`
* `struct:?+69up Xixia County Cornus Officinalis Pathogen Study in Henan -> Hebei-Liaoning-Yunnan Research Corridor (structural)`
* `struct:?+68up Hebei-Liaoning-Yunnan Research Corridor -> Xixia County Cornus Officinalis Pathogen Study in Henan (structural)`
* `struct:?+68up Jehol Biota & Yixian Formation in NE China -> Hebei-Liaoning-Yunnan Research Corridor (structural)`
**4. Causal LLM output:**
* `Identifying causal graph and spurious information (Full prompt available in appendix):`
* `['precise': 'T1', 'T4', ...]`
* `'cl_precise': 'T7', 'N9', ...]`
* `p_answer': 'Under phosphorus limitation in oil palm, Apase activity is expected to be induced (P deprivation), ...'`
**5. Answer LLM output:**
* `Generate final answer (Full prompt available in appendix):`
* `Acid phosphatase (Apase): In oil palm, Apase activity in leaves and roots is higher under Optimum than under starvation/deficiency in both genotypes. This indicates Apase is upregulated by phosphorus formation in the studied conditions, suggesting it may not be the main adaptive response to P deprivation here.`
* `Pti-interacting serine/threonine kinase: Activity is higher in P-deficiency versus non-prolific genotype specific under P-deficient conditions, indicating...`
**6. Gold Answer:**
* `Acid phosphatase, Apase, higher in P-optimum than starvation and deficiency in leaf and root tissues across both palm genotypes. Apase activity was higher under phosphate-replete conditions and in P-deficiency, together implying that the protein plays a non-prolific adaptive role. Pti-interacting serine/threonine kinase activity in P-deficiency was higher than that under optimum conditions. Apase activity in leaves and roots was higher...`
### Key Observations
The diagram highlights a research process that involves multiple stages of analysis, from initial query formulation to a final "gold answer." The LLM outputs suggest a focus on identifying causal relationships and spurious information. The key finding is that Apase activity is higher under optimal phosphorus conditions, suggesting a non-prolific adaptive role.
### Interpretation
This diagram represents a complex research workflow utilizing LLMs to analyze biological data related to oil palm adaptability under phosphorus limitation. The flow demonstrates a progression from a broad research question to specific findings about the activity of Apase and Pti-interacting serine/threonine kinase. The use of "precision" and "cl_precision" in the Causal LLM output suggests an attempt to refine the causal relationships identified. The "Gold Answer" provides a concise summary of the key findings, indicating that Apase activity is not directly linked to phosphorus deprivation as an adaptive response, but rather is higher under optimal conditions. The diagram suggests a sophisticated approach to biological research, leveraging LLMs for data analysis and causal inference. The inclusion of "full prompt available in appendix" indicates a transparency and reproducibility aspect to the research.