TECHNICAL ASSET FINGERPRINT
d1611ca475f9d7abfc76da0d
Click to view fullscreen
Press ESC or click to close
FOUND IN PAPERS
EXPERT: healer-alpha-free VERSION 1
RUNTIME: free/openrouter/healer-alpha
INTEL_VERIFIED
## Diagram: Scientific Query Answering Pipeline Flowchart
### Overview
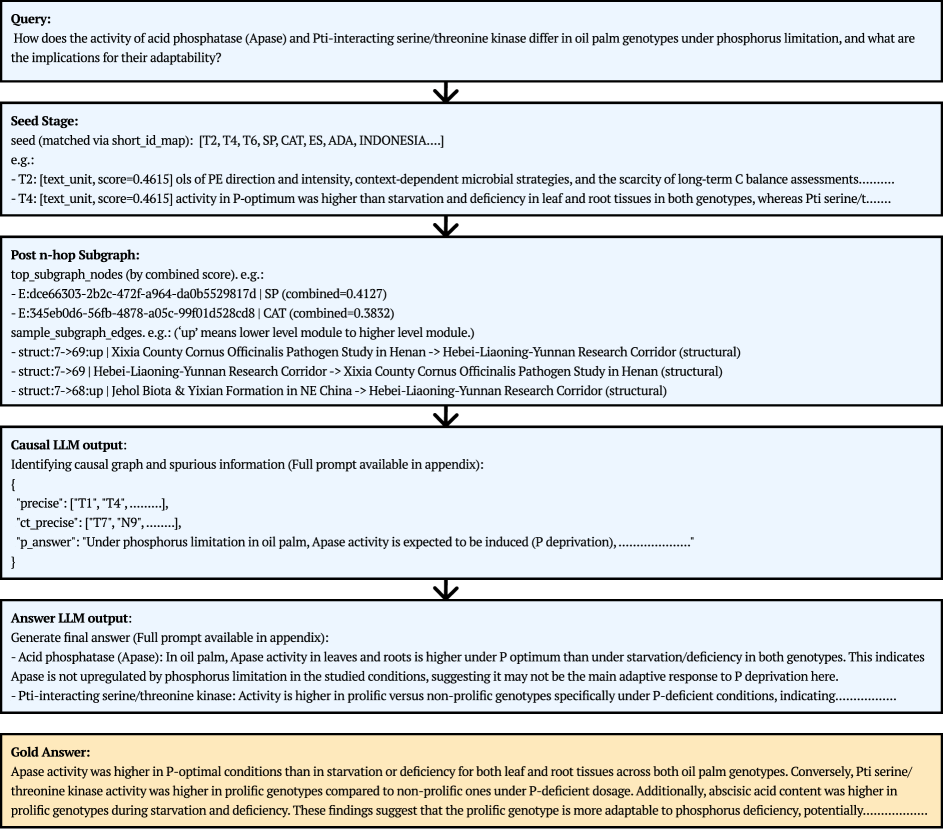
The image displays a vertical flowchart illustrating a multi-stage process for generating a scientific answer to a specific research query about oil palm genotypes. The process flows from an initial query through data retrieval, subgraph analysis, causal reasoning, and final answer generation, culminating in a comparison with a "Gold Answer." The diagram is composed of six rectangular boxes connected by downward-pointing arrows, indicating sequential steps.
### Components/Axes
The diagram is structured as a top-to-bottom flowchart with the following six distinct stages, each contained within a box:
1. **Query Box** (Top, light blue background): Contains the initial research question.
2. **Seed Stage Box** (Light blue background): Describes the initial data retrieval or "seeding" step.
3. **Post n-hop Subgraph Box** (Light blue background): Details the construction and analysis of a knowledge subgraph.
4. **Causal LLM output Box** (Light blue background): Shows the output from a language model tasked with causal reasoning.
5. **Answer LLM output Box** (Light blue background): Presents the final generated answer from a language model.
6. **Gold Answer Box** (Bottom, light orange background): Provides a reference or benchmark answer for comparison.
**Flow Direction:** A single, thick black arrow points downward from the bottom center of each box to the top center of the subsequent box, clearly defining the process sequence.
### Detailed Analysis / Content Details
**1. Query Box:**
* **Text:** "Query: How does the activity of acid phosphatase (Apase) and Pti-interacting serine/threonine kinase differ in oil palm genotypes under phosphorus limitation, and what are the implications for their adaptability?"
**2. Seed Stage Box:**
* **Header:** "Seed Stage:"
* **Content:**
* "seed (matched via short_id_map): [T2, T4, T6, SP, CAT, ES, ADA, INDONESIA....]"
* "e.g.:"
* "- T2: [text_unit, score=0.4615] ols of PE direction and intensity, context-dependent microbial strategies, and the scarcity of long-term C balance assessments..........."
* "- T4: [text_unit, score=0.4615] activity in P-optimum was higher than starvation and deficiency in leaf and root tissues in both genotypes, whereas Pti serine/t......."
**3. Post n-hop Subgraph Box:**
* **Header:** "Post n-hop Subgraph:"
* **Content:**
* "top_subgraph_nodes (by combined score), e.g.:"
* "- E:dce66303-2b2c-472f-a964-da0b5529817d | SP (combined=0.4127)"
* "- E:345eb0d6-56fb-4878-a05c-99f01d528cd8 | CAT (combined=0.3832)"
* "sample_subgraph_edges, e.g. ('up' means lower level module to higher level module.)"
* "- struct:7->69:up | Xixia County Cornus Officinalis Pathogen Study in Henan -> Hebei-Liaoning-Yunnan Research Corridor (structural)"
* "- struct:7->69 | Hebei-Liaoning-Yunnan Research Corridor -> Xixia County Cornus Officinalis Pathogen Study in Henan (structural)"
* "- struct:7->68:up | Jehol Biota & Yixian Formation in NE China -> Hebei-Liaoning-Yunnan Research Corridor (structural)"
**4. Causal LLM output Box:**
* **Header:** "Causal LLM output:"
* **Content:**
* "Identifying causal graph and spurious information (Full prompt available in appendix):"
* "{"
* " 'precise': ['T1', 'T4', .........],"
* " 'ct_precise': ['T7', 'N9', .........],"
* " 'p_answer': 'Under phosphorus limitation in oil palm, Apase activity is expected to be induced (P deprivation),....................'"
* "}"
**5. Answer LLM output Box:**
* **Header:** "Answer LLM output:"
* **Content:**
* "Generate final answer (Full prompt available in appendix):"
* "- Acid phosphatase (Apase): In oil palm, Apase activity in leaves and roots is higher under P optimum than under starvation/deficiency in both genotypes. This indicates Apase is not upregulated by phosphorus limitation in the studied conditions, suggesting it may not be the main adaptive response to P deprivation here."
* "- Pti-interacting serine/threonine kinase: Activity is higher in prolific versus non-prolific genotypes specifically under P-deficient conditions, indicating..............."
**6. Gold Answer Box:**
* **Header:** "Gold Answer:"
* **Content:**
* "Apase activity was higher in P-optimal conditions than in starvation or deficiency for both leaf and root tissues across both oil palm genotypes. Conversely, Pti serine/threonine kinase activity was higher in prolific genotypes compared to non-prolific ones under P-deficient dosage. Additionally, abscisic acid content was higher in prolific genotypes during starvation and deficiency. These findings suggest that the prolific genotype is more adaptable to phosphorus deficiency, potentially..............."
### Key Observations
* **Process Structure:** The diagram outlines a clear, linear pipeline for transforming a natural language query into a structured, evidence-based answer.
* **Data Integration:** The "Seed Stage" and "Post n-hop Subgraph" boxes show the integration of retrieved text units (with relevance scores) and structured knowledge graph data (nodes and edges with types and relationships).
* **LLM Roles:** Two distinct LLM stages are shown: a "Causal LLM" for reasoning and filtering, and an "Answer LLM" for final synthesis.
* **Benchmark Comparison:** The final "Gold Answer" is visually distinguished (orange background) and serves as a reference point, suggesting the pipeline's output is meant to be evaluated against this standard.
* **Content Consistency:** The core scientific findings mentioned in the "Answer LLM output" and "Gold Answer" are consistent regarding the direction of enzyme activity changes (Apase higher in P-optimum, Pti kinase higher in prolific genotypes under P-deficiency).
### Interpretation
This diagram represents a sophisticated **Retrieval-Augmented Generation (RAG) or knowledge-grounded question-answering system** tailored for scientific literature. It demonstrates a method to move beyond simple text retrieval by:
1. **Contextualizing the Query:** Starting with a specific biological question.
2. **Multi-Source Evidence Gathering:** Retrieving relevant text passages ("seeds") and mapping them to a structured knowledge graph ("subgraph") to capture relationships between concepts (e.g., linking a "Pathogen Study" to a "Research Corridor").
3. **Causal Reasoning:** Employing an LLM to distinguish precise, causal information from spurious correlations within the retrieved data.
4. **Synthesis and Generation:** Using another LLM to formulate a coherent, final answer based on the filtered evidence.
5. **Validation:** The inclusion of a "Gold Answer" implies this pipeline is part of a system where generated answers are benchmarked against expert-derived truths, likely for training or evaluation purposes.
The process highlights the challenge of synthesizing information from unstructured text and structured data to answer complex, multi-faceted scientific questions. The ellipses ("...........") in the text suggest the outputs are truncated for the diagram, indicating the actual process handles more extensive data. The pipeline aims to produce answers that are not just factually correct but also causally sound and grounded in a network of evidence.
DECODING INTELLIGENCE...