# Technical Document Extraction: Multi-Topic Influence Analysis
## Overview
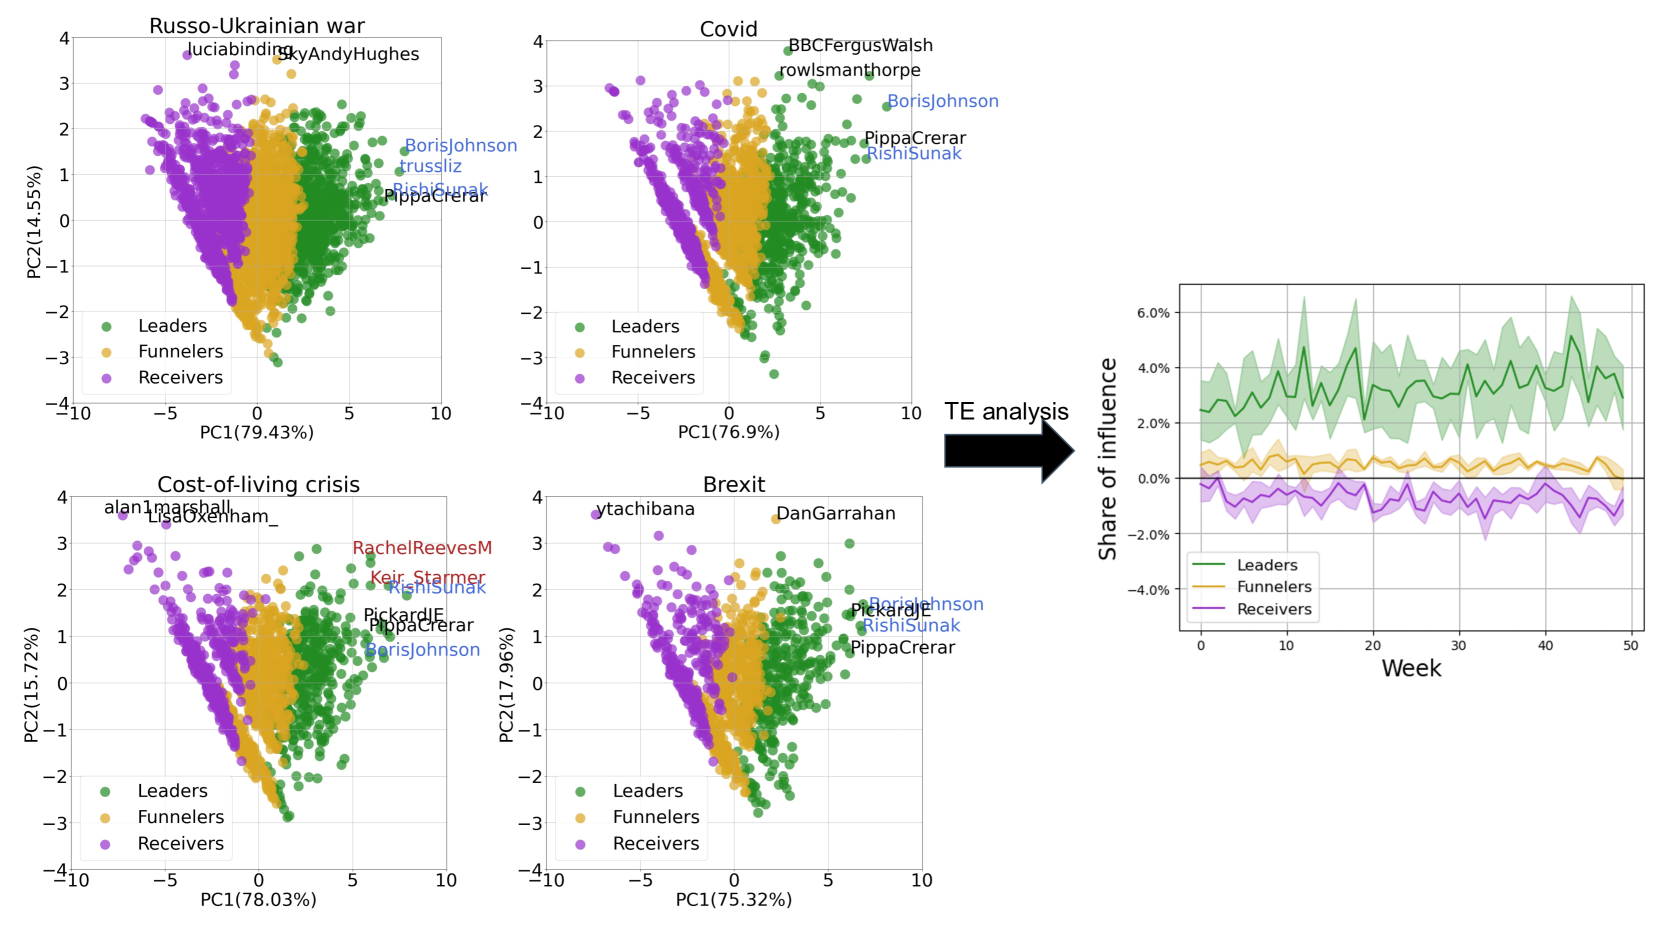
The image contains four scatter plots (PCA visualizations) and one line graph (temporal analysis), analyzing influence dynamics across four topics: Russo-Ukrainian war, Covid, Cost-of-living crisis, and Brexit. Each plot uses Principal Component Analysis (PCA) to reduce dimensionality, with PC1 and PC2 axes explaining variance percentages. A line graph shows temporal trends in influence share.
---
## Scatter Plot Details
### 1. Russo-Ukrainian War
- **Axes**:
- X-axis: PC1 (79.43% variance)
- Y-axis: PC2 (14.55% variance)
- **Legend**:
- Green: Leaders
- Yellow: Funnelers
- Purple: Receivers
- **Key Labels**:
- Leaders: Boris Johnson, Pippa Crerar, Rishi Sunak
- Funnelers: SkyAndyHughes, Luciaibinding
- Receivers: SkyAndyHughes, Luciaibinding
- **Trend**:
- Green cluster (Leaders) dominates the right quadrant.
- Yellow (Funnelers) and purple (Receivers) form overlapping clusters in the left quadrant.
### 2. Covid
- **Axes**:
- X-axis: PC1 (76.9% variance)
- Y-axis: PC2 (15.72% variance)
- **Legend**: Same as above.
- **Key Labels**:
- Leaders: Boris Johnson, Pippa Crerar, Rishi Sunak
- Funnelers: BBCFergusWalsh, rowslsmanthorpe
- Receivers: BBCFergusWalsh, rowslsmanthorpe
- **Trend**:
- Green cluster (Leaders) spans the right quadrant.
- Yellow (Funnelers) and purple (Receivers) overlap in the left quadrant.
### 3. Cost-of-Living Crisis
- **Axes**:
- X-axis: PC1 (78.03% variance)
- Y-axis: PC2 (15.72% variance)
- **Legend**: Same as above.
- **Key Labels**:
- Leaders: Pippa Crerar, Rishi Sunak, Boris Johnson
- Funnelers: RachelleReevesM, Keir Starmer
- Receivers: alan1marshall, LisaOxenham_
- **Trend**:
- Green cluster (Leaders) dominates the right.
- Yellow (Funnelers) and purple (Receivers) form overlapping clusters in the left.
### 4. Brexit
- **Axes**:
- X-axis: PC1 (75.32% variance)
- Y-axis: PC2 (17.96% variance)
- **Legend**: Same as above.
- **Key Labels**:
- Leaders: Pippa Crerar, Rishi Sunak, Boris Johnson
- Funnelers: ytachibana, DanGarrahan
- Receivers: ytachibana, DanGarrahan
- **Trend**:
- Green cluster (Leaders) spans the right quadrant.
- Yellow (Funnelers) and purple (Receivers) overlap in the left.
---
## Line Graph: Temporal Influence Analysis
- **Title**: TE analysis
- **Axes**:
- X-axis: Week (0–50)
- Y-axis: Share of influence (%)
- **Lines**:
- Green: Leaders (fluctuates ~4% with peaks up to 6%)
- Yellow: Funnelers (stable ~2%)
- Purple: Receivers (stable ~0%)
- **Shading**:
- Confidence intervals (10% range) around each line.
- **Trend**:
- Leaders show volatility but remain dominant.
- Funnelers and Receivers exhibit minimal change over time.
---
## Spatial Grounding & Validation
- **Legend Placement**: Bottom-right corner of all scatter plots.
- **Color Consistency**:
- Green (Leaders) matches all green data points.
- Yellow (Funnelers) matches all yellow data points.
- Purple (Receivers) matches all purple data points.
- **Axis Labels**: All PC1/PC2 percentages and axis titles are explicitly stated.
---
## Additional Notes
- **Language**: All text is in English.
- **Data Structure**:
- Scatter plots use PCA for dimensionality reduction.
- Line graph tracks temporal influence share.
- **Missing Data**: No explicit data tables; trends inferred from visual patterns.
---
## Conclusion
The analysis reveals consistent leadership influence across topics, with Funnelers and Receivers showing topic-specific clustering. Temporal trends indicate stable influence hierarchies over time.