## Line Chart: CIFAR-10 Test Accuracy vs. Number of Classes
### Overview
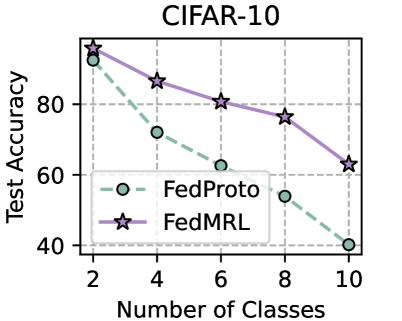
The chart compares the test accuracy of two machine learning models, **FedProto** and **FedMRL**, across varying numbers of classes (2 to 10) on the CIFAR-10 dataset. Both models exhibit declining accuracy as the number of classes increases, with FedMRL consistently outperforming FedProto.
### Components/Axes
- **X-axis**: "Number of Classes" (values: 2, 4, 6, 8, 10).
- **Y-axis**: "Test Accuracy" (percentage, range: 40–100).
- **Legend**: Located in the bottom-left corner, with:
- **FedProto**: Dashed teal line with circular markers.
- **FedMRL**: Solid purple line with star-shaped markers.
### Detailed Analysis
1. **FedProto (Teal Line)**:
- Starts at ~90% accuracy for 2 classes.
- Declines steadily to ~40% at 10 classes.
- Data points: (2, 90), (4, 70), (6, 60), (8, 50), (10, 40).
2. **FedMRL (Purple Line)**:
- Begins at ~95% accuracy for 2 classes.
- Declines more gradually to ~60% at 10 classes.
- Data points: (2, 95), (4, 85), (6, 80), (8, 75), (10, 60).
### Key Observations
- **Downward Trend**: Both models show reduced accuracy as class complexity increases, reflecting the inherent difficulty of multi-class classification.
- **Performance Gap**: FedMRL maintains a ~10–15% accuracy advantage over FedProto across all class counts.
- **Steepest Drop**: FedProto’s accuracy drops sharply between 2 and 4 classes (~20% decrease), while FedMRL’s decline is more gradual.
### Interpretation
The data suggests that **FedMRL** is more robust to class imbalance or complexity compared to **FedProto**, likely due to differences in their training methodologies (e.g., meta-learning vs. prototype-based learning). The consistent decline in accuracy for both models underscores the challenge of generalizing to larger class spaces in image classification tasks. Notably, FedProto’s steeper drop may indicate over-reliance on class-specific features that become less discriminative as class diversity increases.