## Scatter Plot: Architecture Ranking by Components
### Overview
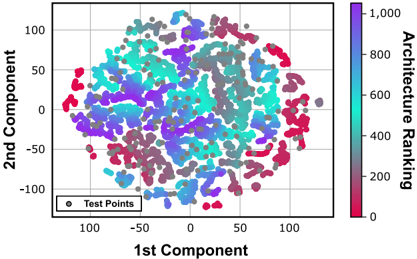
The image is a scatter plot showing the distribution of data points in a two-dimensional space defined by "1st Component" and "2nd Component". The data points are colored according to an "Architecture Ranking" scale, ranging from red (low) to purple (high). Gray dots are overlaid on the colored data points, labeled as "Test Points".
### Components/Axes
* **X-axis (1st Component):** Ranges from approximately -100 to 100, with gridlines at intervals of 50.
* **Y-axis (2nd Component):** Ranges from approximately -100 to 100, with gridlines at intervals of 50.
* **Color Scale (Architecture Ranking):** A vertical color bar on the right side of the plot represents the "Architecture Ranking". The scale ranges from 0 (red) to 1000 (purple), with intermediate colors of gray, teal, and blue.
* **Legend:** Located in the bottom-left corner, indicating that the gray dots represent "Test Points".
### Detailed Analysis
* **Data Point Distribution:** The data points form a roughly circular cluster, with higher density in the central region.
* **Color Gradient:** The color gradient indicates that lower architecture rankings (red) are concentrated on the right side of the plot, while higher rankings (purple) are more prevalent in the upper and central regions.
* **Test Points:** The gray "Test Points" are scattered throughout the plot, appearing to overlay the colored data points.
### Key Observations
* There is a clear correlation between the position of data points and their architecture ranking.
* The distribution of data points is not uniform, with some areas having higher concentrations of specific rankings.
* The "Test Points" appear to be a subset of the overall data, possibly representing a validation or test set.
### Interpretation
The scatter plot visualizes the relationship between two components and the architecture ranking of data points. The clustering of points with similar rankings suggests that these components are relevant features for distinguishing between different architectures. The color gradient indicates a trend where higher component values are associated with higher architecture rankings. The "Test Points" likely represent a subset of the data used to evaluate the performance of a model or algorithm. The plot could be used to identify promising architectures or to understand the feature space of the underlying data.