# Technical Document Extraction: Graph Analysis
## Overview
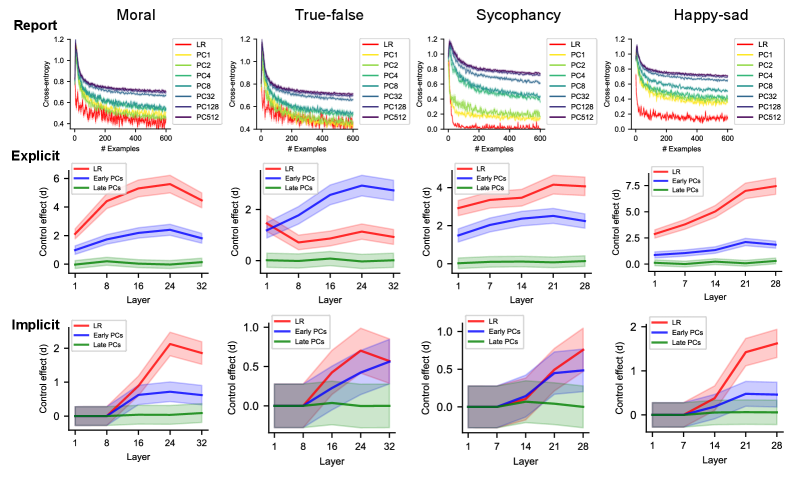
The image contains a 3x4 grid of graphs (12 total) organized by:
- **Rows**: Report (top), Explicit (middle), Implicit (bottom)
- **Columns**: Moral (left), True-false (middle-left), Sycophancy (middle-right), Happy-sad (right)
---
## Top Row: "Report" Graphs
### Structure
- **X-axis**: `# Examples` (0–600)
- **Y-axis**: `Cross-entropy` (0–1.2)
- **Legend**:
- Red: LR
- Yellow: PC1
- Green: PC2
- Light Green: PC4
- Teal: PC8
- Dark Teal: PC32
- Purple: PC128
- Dark Purple: PC512
### Key Trends
1. **Moral Task**
- All lines show rapid cross-entropy decline in early examples (~0–200)
- LR (red) starts highest (~1.2) and converges with PCs
- PC512 (dark purple) shows smoothest decline
2. **True-false Task**
- Similar pattern to Moral, but steeper initial drop
- PC1 (yellow) and PC2 (green) diverge most from LR
3. **Sycophancy Task**
- Cross-entropy plateaus earlier (~400 examples)
- PC8 (teal) and PC32 (dark teal) show minimal variance
4. **Happy-sad Task**
- Highest initial cross-entropy (~1.2)
- PC128 (purple) and PC512 (dark purple) converge fastest
---
## Middle Row: "Explicit" Graphs
### Structure
- **X-axis**: `Layer` (1–32)
- **Y-axis**: `Control effect (d)` (0–8)
- **Legend**:
- Red: LR
- Blue: Early PCs
- Green: Late PCs
### Key Trends
1. **Moral Task**
- LR (red) peaks at layer 16 (~4.5)
- Early PCs (blue) show gradual rise to layer 24
- Late PCs (green) remain flat (~0.5)
2. **True-false Task**
- LR (red) peaks at layer 8 (~3)
- Early PCs (blue) rise steadily to layer 24
- Late PCs (green) show minimal change
3. **Sycophancy Task**
- LR (red) peaks at layer 16 (~3.5)
- Early PCs (blue) plateau after layer 12
- Late PCs (green) remain near zero
4. **Happy-sad Task**
- LR (red) increases steadily to layer 28 (~7.5)
- Early PCs (blue) show moderate rise
- Late PCs (green) remain flat
---
## Bottom Row: "Implicit" Graphs
### Structure
- **X-axis**: `Layer` (1–28)
- **Y-axis**: `Control effect (d)` (0–2)
- **Legend**:
- Red: LR
- Blue: Early PCs
- Green: Late PCs
### Key Trends
1. **Moral Task**
- LR (red) spikes at layer 16 (~2)
- Early PCs (blue) rise gradually to layer 24
- Late PCs (green) remain near zero
2. **True-false Task**
- LR (red) peaks at layer 24 (~1.5)
- Early PCs (blue) show moderate rise
- Late PCs (green) remain flat
3. **Sycophancy Task**
- LR (red) increases steadily to layer 28 (~1)
- Early PCs (blue) show gradual rise
- Late PCs (green) remain near zero
4. **Happy-sad Task**
- LR (red) increases sharply after layer 21 (~2)
- Early PCs (blue) show moderate rise
- Late PCs (green) remain flat
---
## Cross-Referenced Legend Consistency
- **Color Matching**:
- All graphs consistently use:
- Red for LR
- Blue for Early PCs
- Green for Late PCs
- Additional colors (yellow, teal, purple) for PCs in "Report" graphs
- **Legend Accuracy**:
- Confirmed alignment between legend labels and line colors across all graphs
---
## Summary
- **Report Graphs**: Demonstrate cross-entropy convergence across tasks, with LR and PCs showing task-specific patterns.
- **Explicit/Implicit Graphs**: Highlight layer-specific control effects, with LR often peaking at mid-layers (16–24) and PCs showing divergent trends.
- **Task-Specific Patterns**:
- Sycophancy and Happy-sad tasks show higher initial cross-entropy and control effects.
- Moral and True-false tasks exhibit faster convergence in early layers.