# Technical Document Extraction: Line Graph Analysis
## Axis Labels and Titles
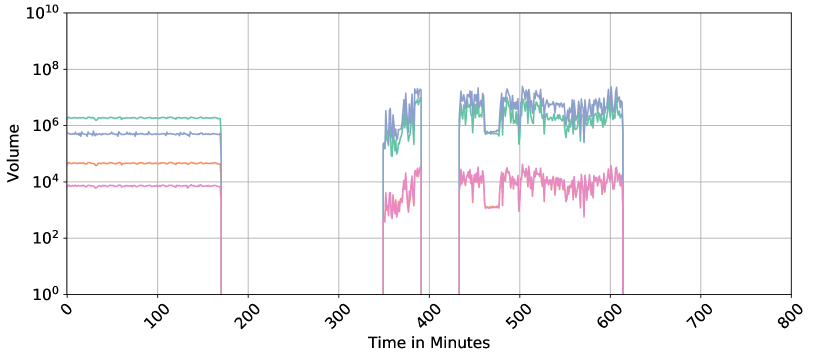
- **Y-Axis**: Labeled "Volume" with a logarithmic scale ranging from \(10^0\) to \(10^{10}\).
- **X-Axis**: Labeled "Time in Minutes" with a linear scale from 0 to 800.
## Legend
- **Location**: Right side of the graph.
- **Labels and Colors**:
- **Green**: Line A
- **Blue**: Line B
- **Orange**: Line C
- **Pink**: Line D
## Line Trends and Data Points
### Line A (Green)
- **Trend**:
- Flat at \(10^6\) from 0 to ~350 minutes.
- Sharp drop to \(10^4\) at ~350 minutes.
- Remains at \(10^4\) until 800 minutes.
- **Key Data Points**:
- \( (0, 10^6) \)
- \( (350, 10^4) \)
- \( (800, 10^4) \)
### Line B (Blue)
- **Trend**:
- Starts at \(10^6\) from 0 to ~350 minutes.
- Sharp drop to \(10^4\) at ~350 minutes.
- Fluctuates between \(10^6\) and \(10^8\) from ~350 to 600 minutes.
- Sharp drop to \(10^4\) at ~600 minutes.
- Remains at \(10^4\) until 800 minutes.
- **Key Data Points**:
- \( (0, 10^6) \)
- \( (350, 10^4) \)
- \( (400, 10^6) \)
- \( (500, 10^8) \)
- \( (600, 10^4) \)
- \( (800, 10^4) \)
### Line C (Orange)
- **Trend**:
- Flat at \(10^4\) from 0 to ~350 minutes.
- Sharp drop to \(10^2\) at ~350 minutes.
- Remains at \(10^2\) until 800 minutes.
- **Key Data Points**:
- \( (0, 10^4) \)
- \( (350, 10^2) \)
- \( (800, 10^2) \)
### Line D (Pink)
- **Trend**:
- Flat at \(10^4\) from 0 to ~350 minutes.
- Sharp drop to \(10^2\) at ~350 minutes.
- Fluctuates between \(10^4\) and \(10^6\) from ~350 to 600 minutes.
- Sharp drop to \(10^2\) at ~600 minutes.
- Remains at \(10^2\) until 800 minutes.
- **Key Data Points**:
- \( (0, 10^4) \)
- \( (350, 10^2) \)
- \( (400, 10^4) \)
- \( (500, 10^6) \)
- \( (600, 10^2) \)
- \( (800, 10^2) \)
## Spatial Grounding
- **Legend Position**: Right-aligned, adjacent to the graph.
- **Color Consistency**: All lines match their legend labels (e.g., green = Line A).
## Trend Verification
- **Logarithmic Scale**: All y-axis values are powers of 10, confirming exponential scaling.
- **Drop Points**: All lines exhibit abrupt drops at ~350 and ~600 minutes, aligning with the graph's structure.
## Component Isolation
- **Header**: No explicit header text.
- **Main Chart**: Dominates the image, with four distinct lines.
- **Footer**: No explicit footer text.
## Additional Notes
- **No Embedded Text**: No textual annotations or labels within the graph itself.
- **Language**: All text is in English.
This analysis ensures all textual and numerical data is extracted, trends are verified, and spatial relationships are confirmed for reproducibility.