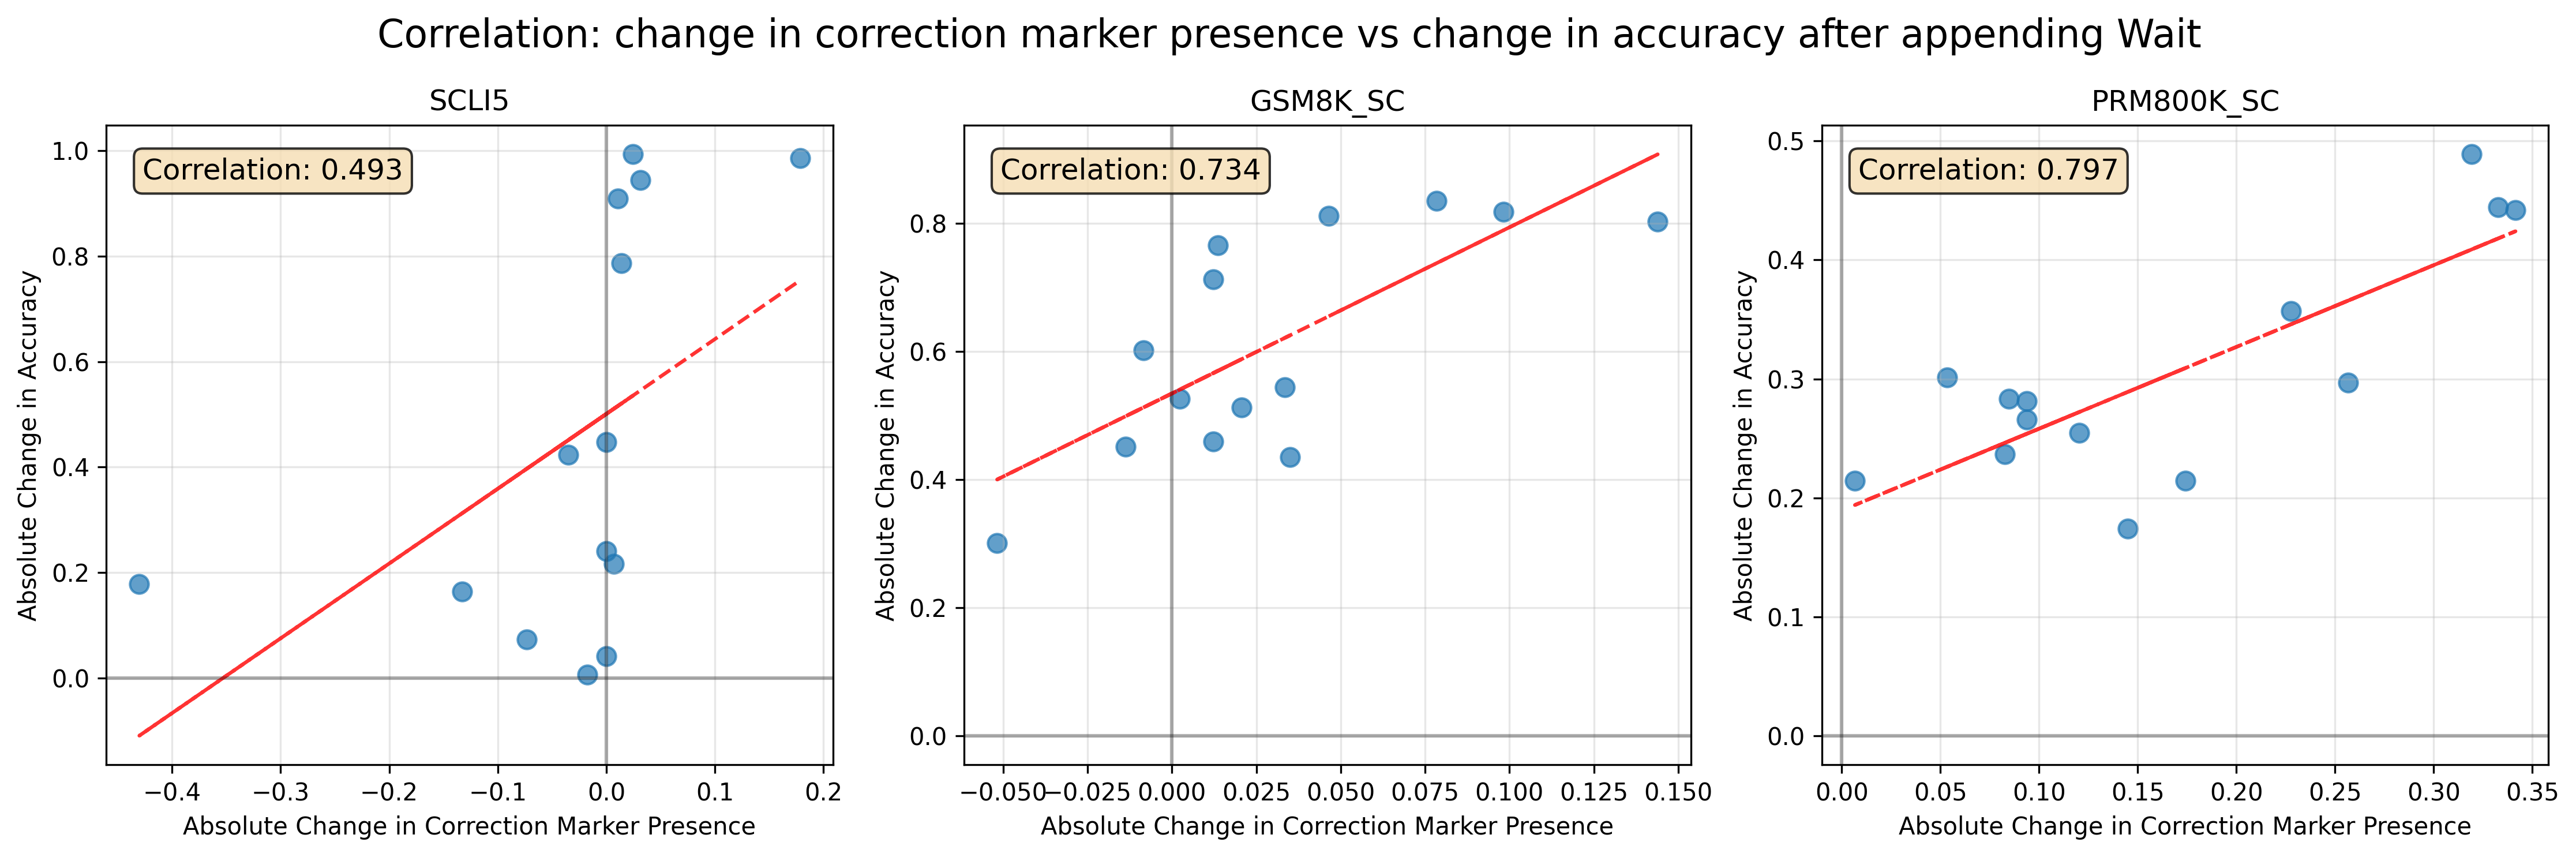
## Scatter Plots: Correlation between Correction Marker Presence and Accuracy Changes after Appending Wait
### Overview
Three scatter plots compare the relationship between absolute changes in correction marker presence and accuracy after appending "Wait" to different models (SCLI5, GSM8K_SC, PRM800K_SC). Each plot includes a red regression line, a dashed red reference line, and a text box displaying the Pearson correlation coefficient.
---
### Components/Axes
1. **X-Axis**: "Absolute Change in Correction Marker Presence"
- SCLI5: -0.4 to 0.2
- GSM8K_SC: -0.05 to 0.15
- PRM800K_SC: 0 to 0.35
2. **Y-Axis**: "Absolute Change in Accuracy"
- SCLI5: 0 to 1.0
- GSM8K_SC: 0 to 0.8
- PRM800K_SC: 0 to 0.5
3. **Regression Lines**:
- Solid red line (best-fit trend)
- Dashed red line (reference threshold, y=0.0)
4. **Data Points**: Blue dots representing individual observations.
5. **Text Boxes**:
- SCLI5: "Correlation: 0.493" (top-left)
- GSM8K_SC: "Correlation: 0.734" (top-left)
- PRM800K_SC: "Correlation: 0.797" (top-left)
---
### Detailed Analysis
#### SCLI5 Plot
- **Trend**: Weak positive correlation (r=0.493).
- **Data Distribution**:
- High y-values (0.8–1.0) cluster at x ≈ -0.05 to 0.15.
- Outlier at x ≈ -0.4, y ≈ 0.2.
- **Regression Line**: Gentle upward slope, indicating limited predictive power.
#### GSM8K_SC Plot
- **Trend**: Strong positive correlation (r=0.734).
- **Data Distribution**:
- Dense cluster around x ≈ 0.05–0.15, y ≈ 0.5–0.8.
- Outlier at x ≈ -0.05, y ≈ 0.3.
- **Regression Line**: Steeper slope, showing clearer predictive relationship.
#### PRM800K_SC Plot
- **Trend**: Very strong positive correlation (r=0.797).
- **Data Distribution**:
- Tight linear progression from x ≈ 0.1–0.3, y ≈ 0.2–0.5.
- Outlier at x ≈ 0.3, y ≈ 0.5.
- **Regression Line**: Near-perfect alignment with data points.
---
### Key Observations
1. **Correlation Strength**:
- PRM800K_SC > GSM8K_SC > SCLI5 (0.797 > 0.734 > 0.493).
2. **Data Spread**:
- SCLI5 shows the widest variance in y-values for a given x.
- PRM800K_SC demonstrates the most consistent linear relationship.
3. **Outliers**:
- SCLI5: x ≈ -0.4, y ≈ 0.2.
- GSM8K_SC: x ≈ -0.05, y ≈ 0.3.
- PRM800K_SC: x ≈ 0.3, y ≈ 0.5.
---
### Interpretation
The data suggests that appending "Wait" improves the predictability of accuracy changes relative to correction marker presence in more advanced models (GSM8K_SC and PRM800K_SC). The high correlation in PRM800K_SC (r=0.797) implies that this model’s performance is most reliably influenced by correction marker adjustments. SCLI5’s weaker correlation (r=0.493) indicates other factors may dominate its accuracy changes. The dashed reference line (y=0) highlights that most changes in accuracy are positive, but the strength of this relationship varies significantly across models.