## Diagram: Visual-Audio Processing Pipeline
### Overview
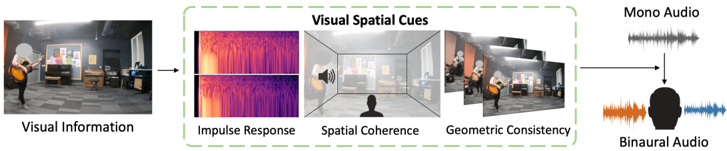
The diagram illustrates a multi-stage pipeline for processing visual and auditory information, emphasizing spatial and geometric cues. It connects visual input (a person playing a guitar) to audio outputs (mono and binaural), with intermediate stages highlighting spatial coherence and geometric consistency.
### Components/Axes
1. **Visual Information**
- **Input**: Image of a person playing a guitar in a room.
- **Labels**: "Visual Information" (bottom-left).
2. **Visual Spatial Cues** (central box with dashed green border)
- **Subcomponents**:
- **Impulse Response**: Two heatmaps (top and bottom) with color gradients (orange to purple). No explicit axis labels or numerical values.
- **Spatial Coherence**: 3D room schematic with a speaker icon emitting sound waves and a silhouette of a listener.
- **Geometric Consistency**: Three overlapping images of the guitarist, showing positional consistency.
3. **Audio Outputs** (right side)
- **Mono Audio**: Single waveform labeled "Mono Audio."
- **Binaural Audio**: Silhouette of a head with orange (left ear) and blue (right ear) waveforms labeled "Binaural Audio."
### Detailed Analysis
- **Impulse Response**: Heatmaps suggest frequency or intensity variations over time, but no numerical data or axis markers are visible.
- **Spatial Coherence**: The 3D room schematic implies spatial mapping of sound sources (e.g., guitar location relative to listener).
- **Geometric Consistency**: Overlapping images emphasize positional stability of the subject across frames.
- **Audio Outputs**: Mono audio is a single-channel waveform; binaural audio uses dual-channel waveforms (orange/blue) to represent directional sound perception.
### Key Observations
- No numerical values, scales, or legends are present in the diagram.
- The flow progresses from visual input → spatial/geometric analysis → audio output.
- Binaural audio is visually distinguished by dual-colored waveforms and a head silhouette.
### Interpretation
The diagram demonstrates how spatial and geometric cues from visual data (e.g., room acoustics, subject positioning) influence audio processing. The absence of explicit numerical data suggests a conceptual rather than quantitative model. The use of heatmaps and 3D schematics implies a focus on perceptual relationships (e.g., how sound localization depends on visual context). The binaural output highlights the integration of spatial audio cues for immersive listening experiences.
## Notes
- **Language**: All text is in English.
- **Missing Data**: No numerical values, axis labels, or legends are provided in the diagram.
- **Assumptions**: Heatmaps likely represent sound intensity/frequency; 3D room schematic implies spatial sound mapping.