## Line Chart: Pass@k vs. k
### Overview
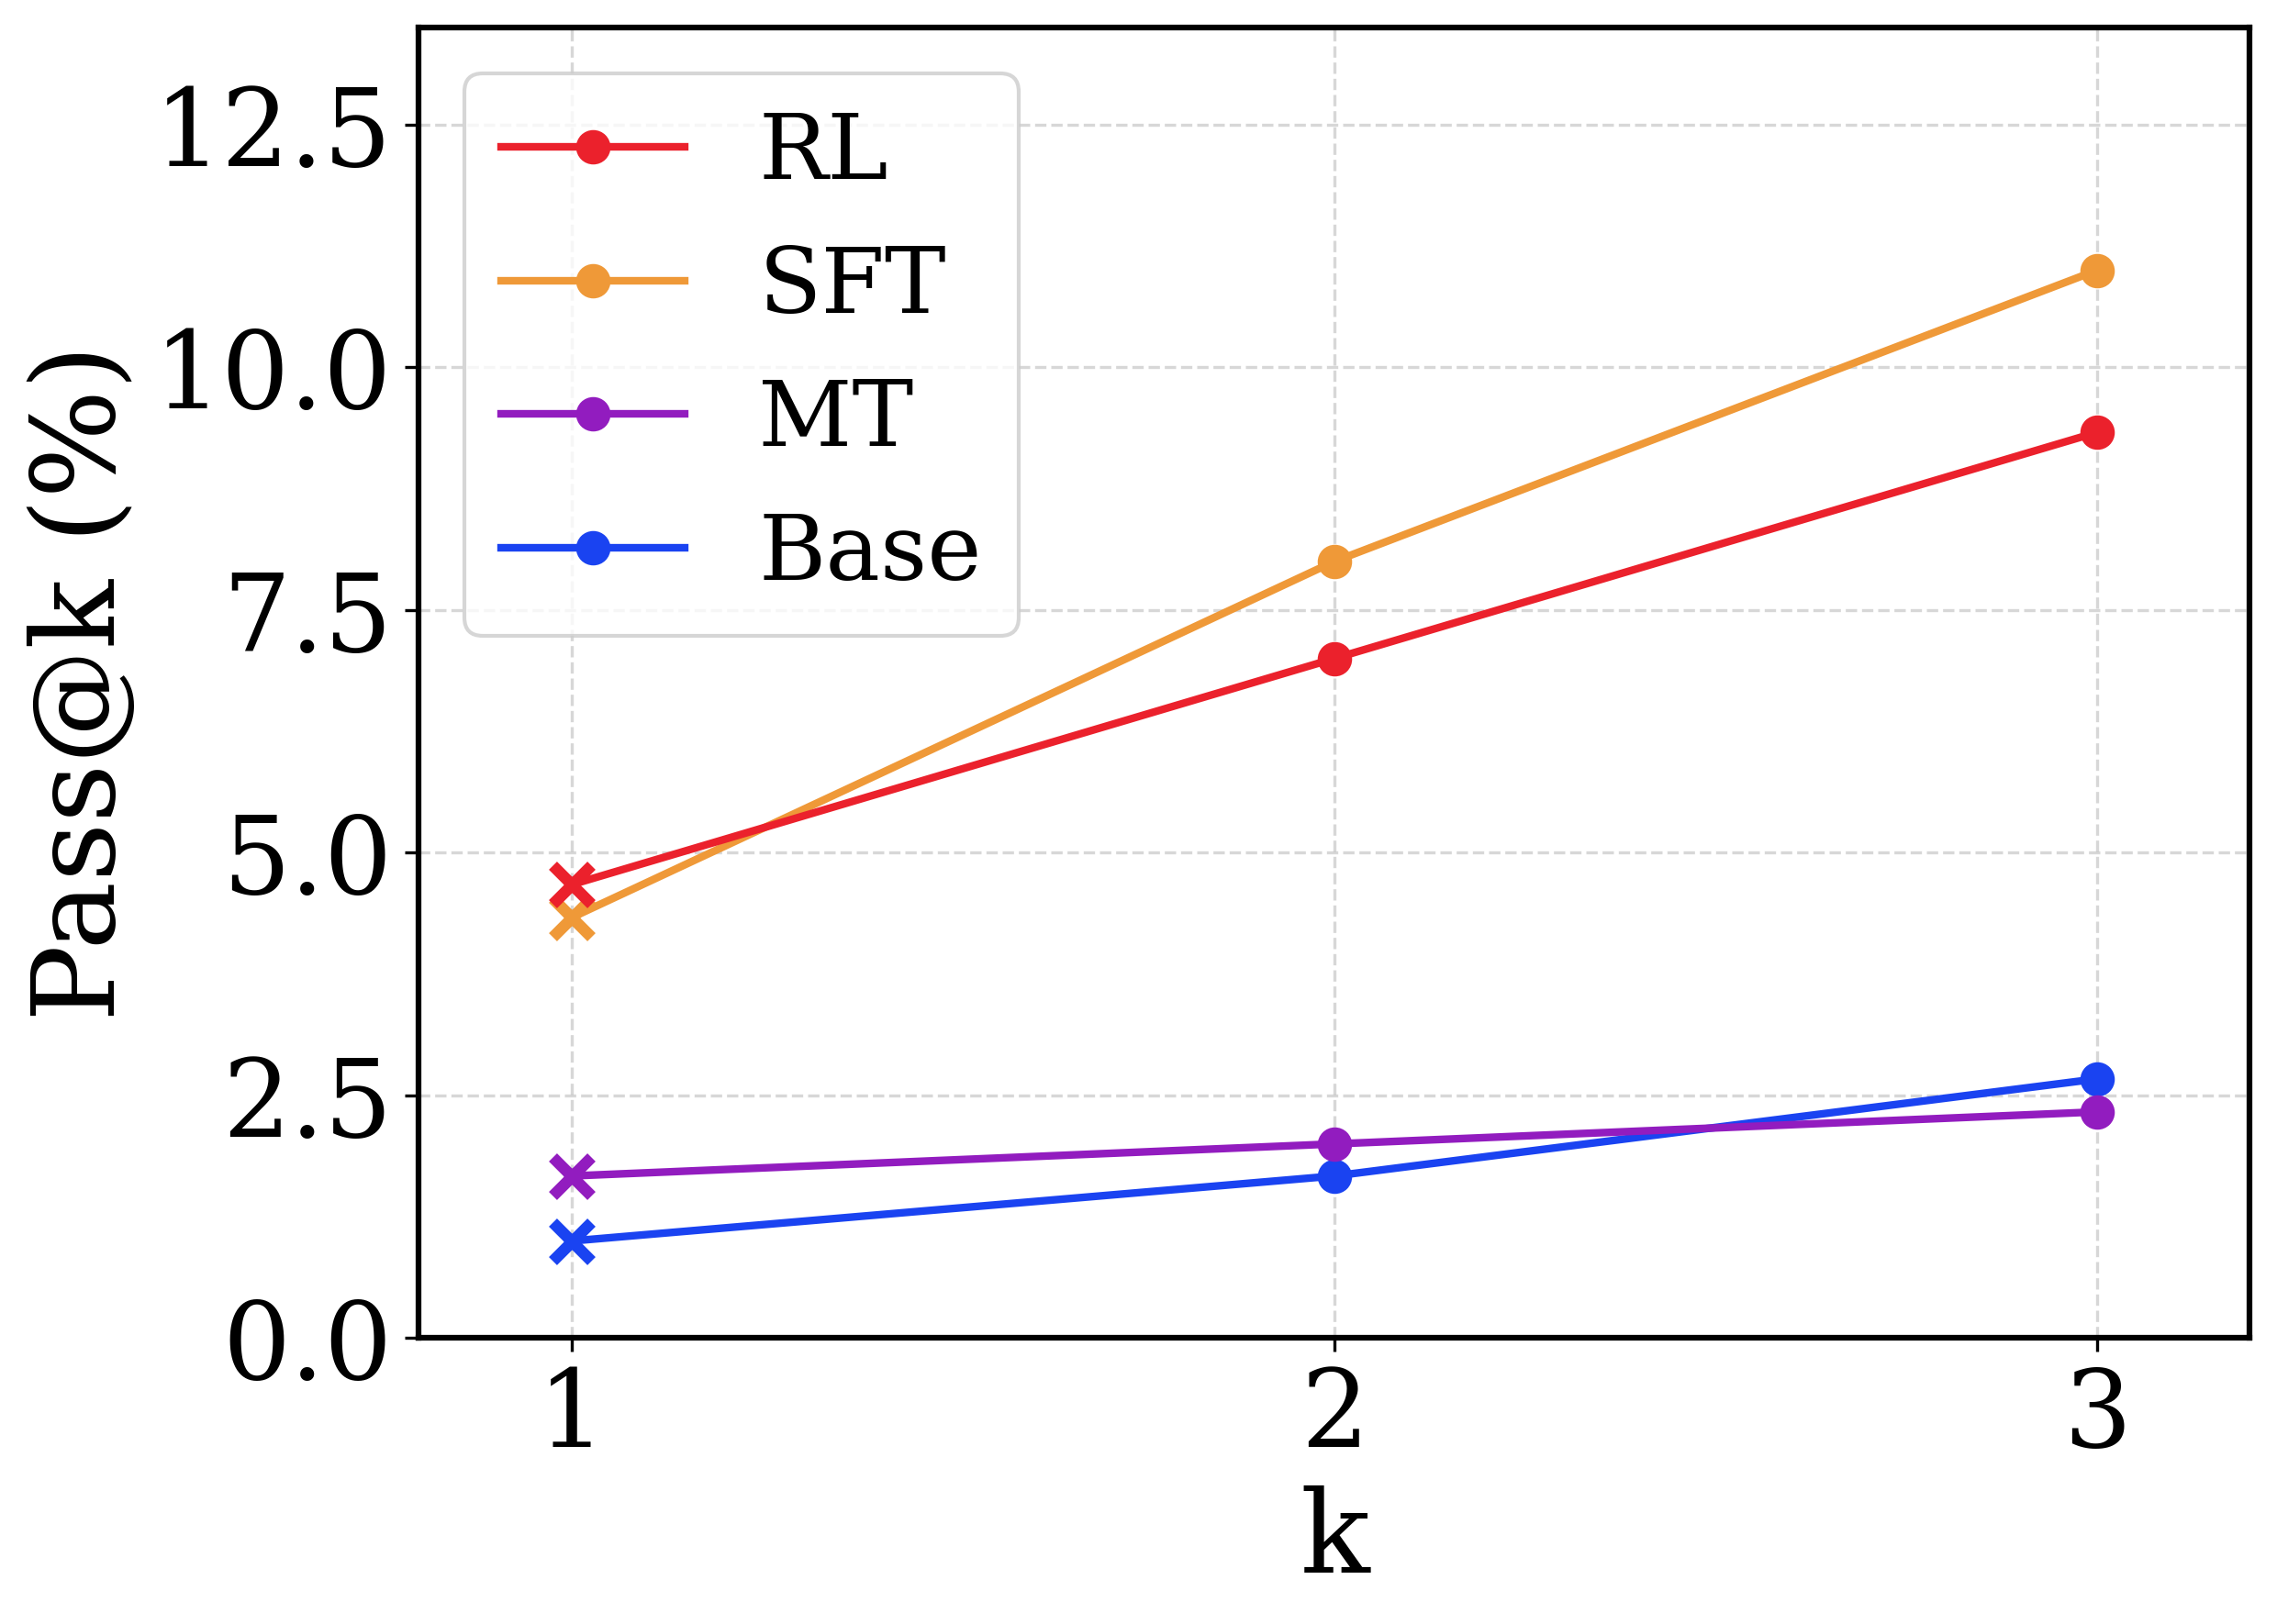
The image is a line chart comparing the performance of four different methods (RL, SFT, MT, and Base) based on the "Pass@k" metric for varying values of 'k' (1, 2, and 3). The chart displays the percentage of successful attempts (Pass@k) on the y-axis against the value of 'k' on the x-axis.
### Components/Axes
* **X-axis:** Labeled "k" with values 1, 2, and 3.
* **Y-axis:** Labeled "Pass@k (%)" with values ranging from 0.0 to 12.5, incrementing by 2.5.
* **Legend:** Located in the top-left corner, associating colors with methods:
* Red: RL
* Orange: SFT
* Purple: MT
* Blue: Base
### Detailed Analysis
* **RL (Red):** The line slopes upward.
* k=1: Approximately 4.8%
* k=2: Approximately 7.2%
* k=3: Approximately 9.4%
* **SFT (Orange):** The line slopes upward.
* k=1: Approximately 4.5%
* k=2: Approximately 8.0%
* k=3: Approximately 11.0%
* **MT (Purple):** The line slopes slightly upward.
* k=1: Approximately 1.8%
* k=2: Approximately 2.0%
* k=3: Approximately 2.4%
* **Base (Blue):** The line slopes slightly upward.
* k=1: Approximately 1.1%
* k=2: Approximately 2.0%
* k=3: Approximately 2.6%
### Key Observations
* SFT consistently outperforms RL across all values of k.
* MT and Base have significantly lower Pass@k values compared to RL and SFT.
* All methods show an increase in Pass@k as k increases from 1 to 3.
* The performance gap between SFT/RL and MT/Base is substantial.
### Interpretation
The chart suggests that SFT and RL are significantly more effective methods than MT and Base, as indicated by their higher Pass@k values. The increasing trend of Pass@k for all methods as 'k' increases implies that allowing more attempts ('k') leads to a higher success rate. The large performance difference between SFT/RL and MT/Base could be due to differences in their underlying algorithms or training methodologies.