# Technical Document Analysis of Line Chart
## 1. Labels and Axis Titles
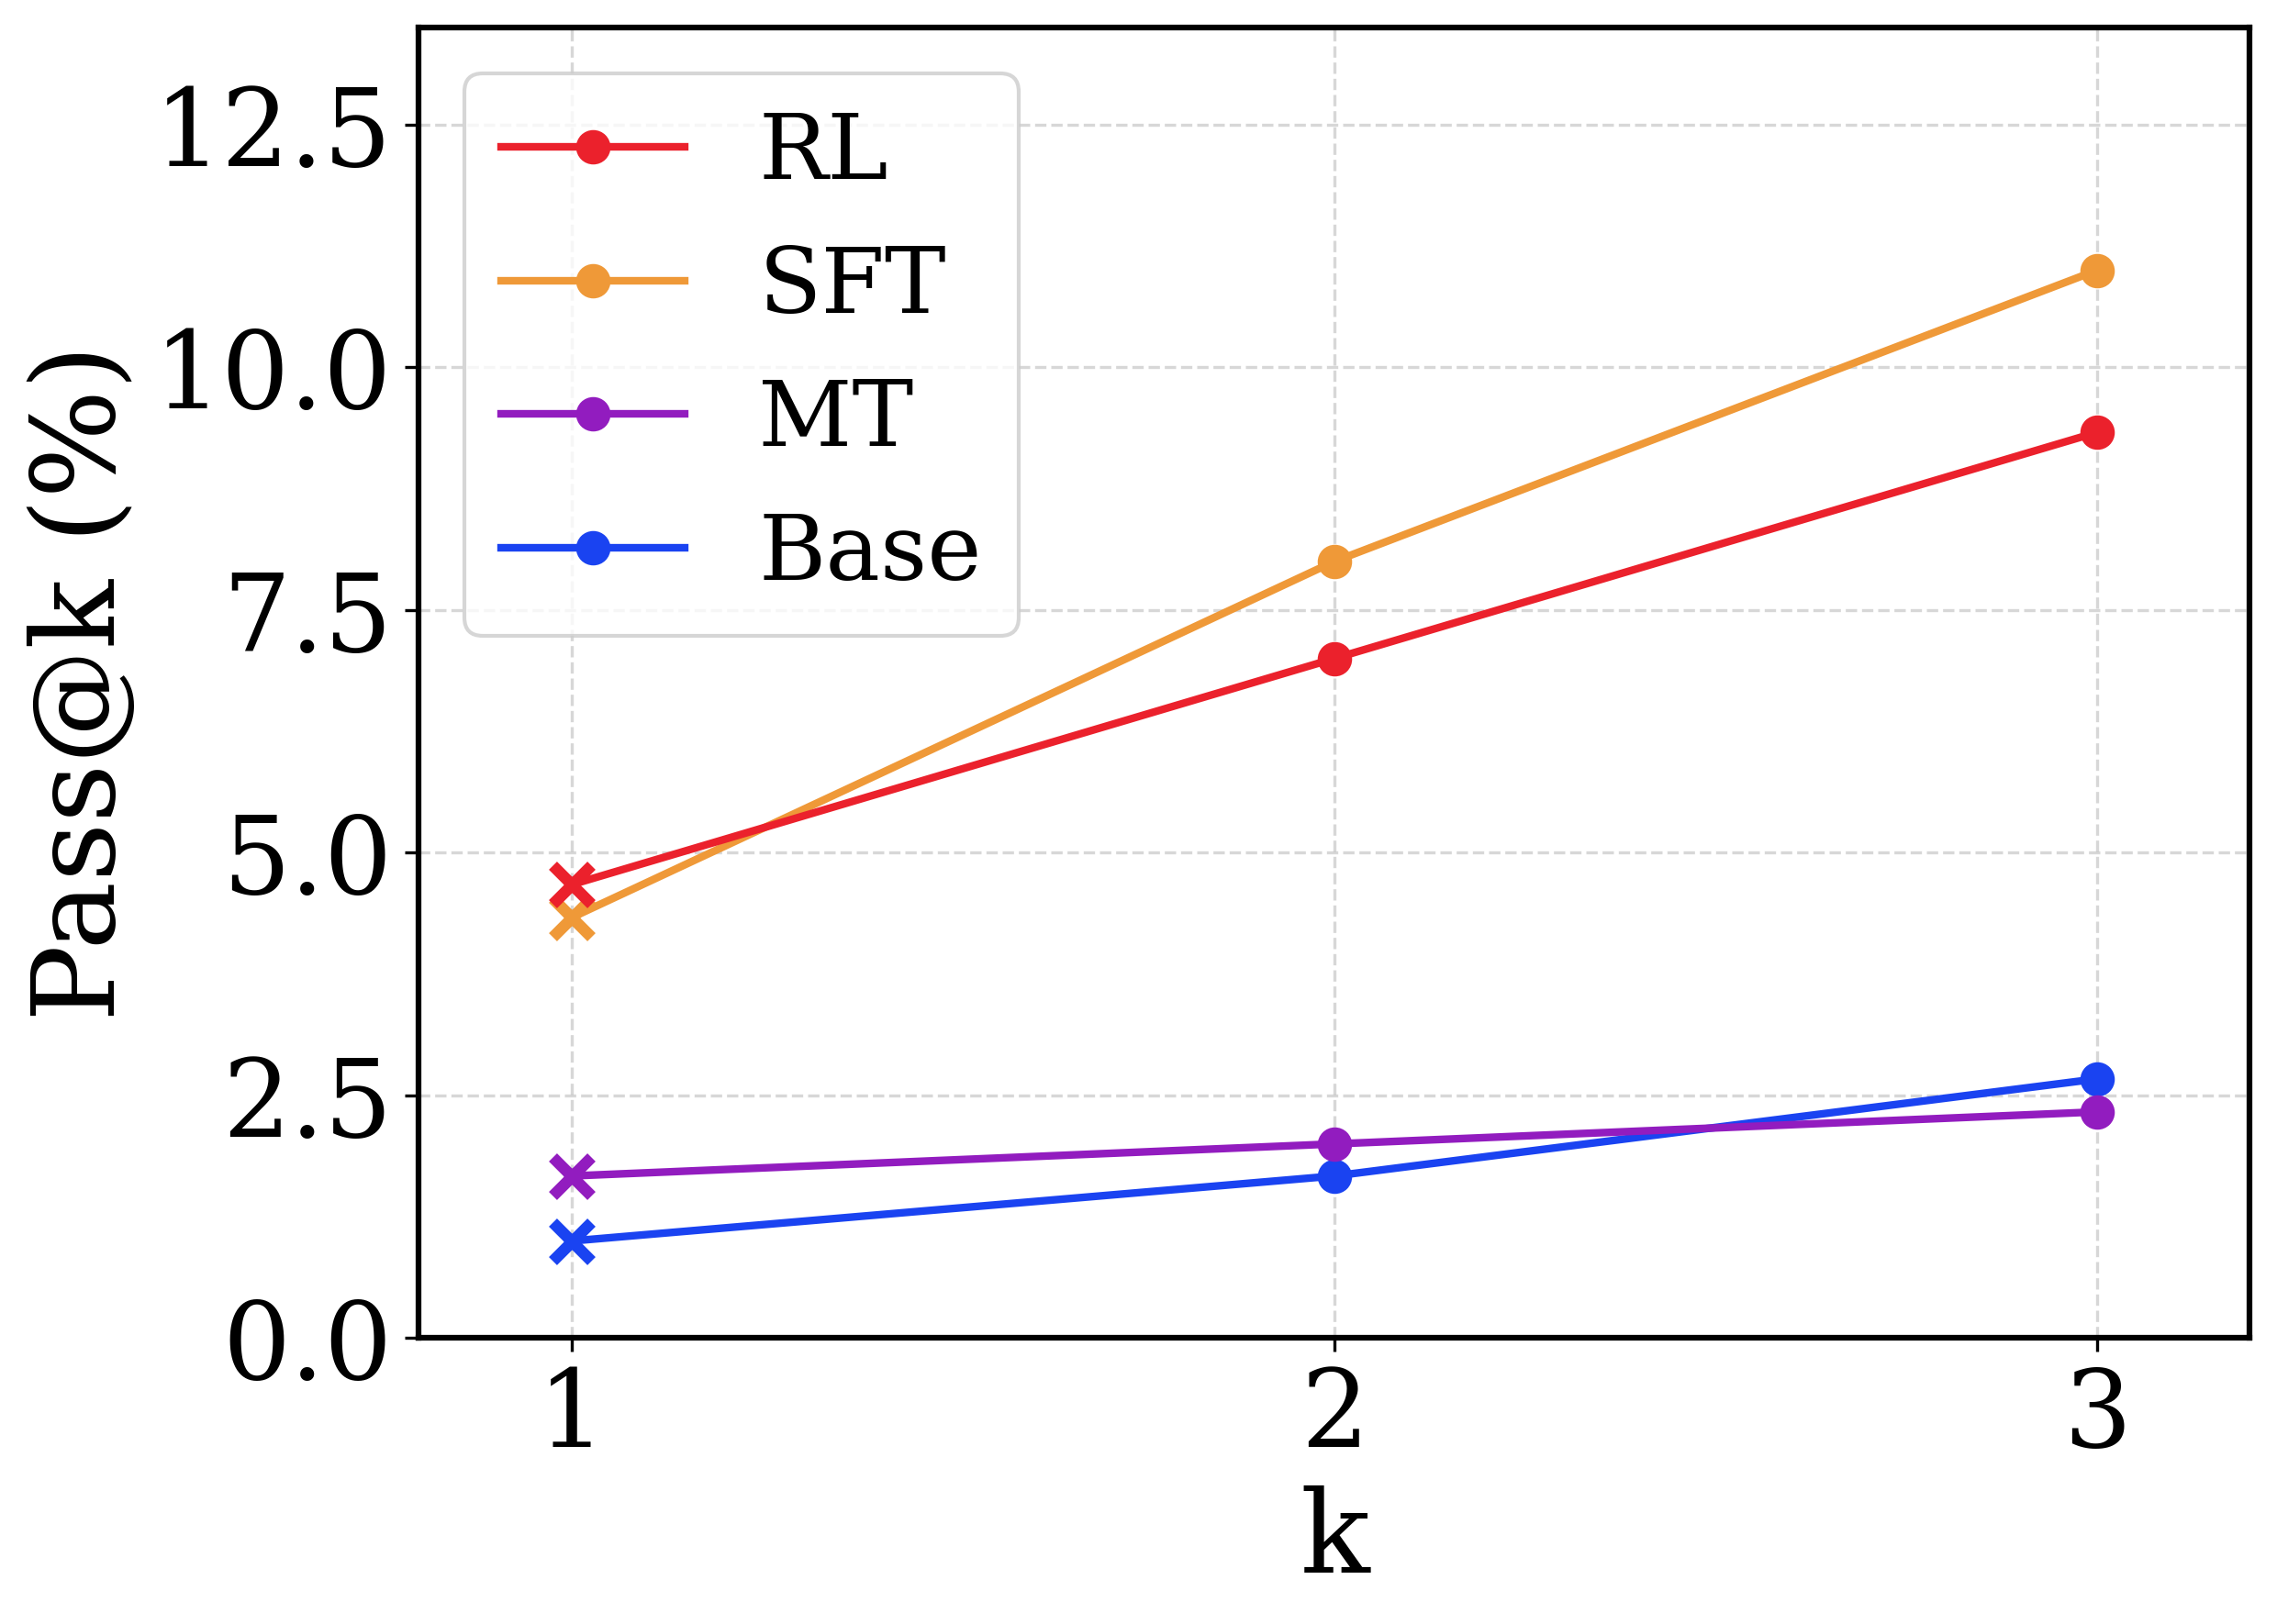
- **X-axis**: Labeled `k` (integer values: 1, 2, 3)
- **Y-axis**: Labeled `Pass@k (%)` (range: 0.0 to 12.5, increments of 2.5)
- **Legend**: Located in the top-left corner, with four entries:
- **RL**: Red line with circular markers
- **SFT**: Orange line with circular markers
- **MT**: Purple line with circular markers
- **Base**: Blue line with circular markers
## 2. Key Trends and Data Points
### RL (Red Line)
- **Trend**: Steadily increasing slope from left to right.
- **Data Points**:
- `k=1`: ~4.8%
- `k=2`: ~7.2%
- `k=3`: ~9.5%
### SFT (Orange Line)
- **Trend**: Starts below RL at `k=1`, crosses RL between `k=1` and `k=2`, then rises sharply.
- **Data Points**:
- `k=1`: ~4.5%
- `k=2`: ~8.0%
- `k=3`: ~11.0%
### MT (Purple Line)
- **Trend**: Flat with a slight upward curve.
- **Data Points**:
- `k=1`: ~1.8%
- `k=2`: ~2.0%
- `k=3`: ~2.5%
### Base (Blue Line)
- **Trend**: Flat with a slight upward curve, parallel to MT.
- **Data Points**:
- `k=1`: ~1.0%
- `k=2`: ~1.5%
- `k=3`: ~2.5%
## 3. Spatial Grounding and Color Verification
- **Legend Position**: Top-left corner (coordinates: [x=0.1, y=0.9] relative to chart bounds).
- **Color Consistency**:
- RL: Red (`#FF0000`) matches all red data points.
- SFT: Orange (`#FFA500`) matches all orange data points.
- MT: Purple (`#800080`) matches all purple data points.
- Base: Blue (`#0000FF`) matches all blue data points.
## 4. Component Isolation
### Header
- No explicit header text; legend serves as the primary identifier.
### Main Chart
- **Axes**:
- X-axis spans `k=1` to `k=3` with gridlines at integer intervals.
- Y-axis spans `0.0%` to `12.5%` with gridlines at 2.5% intervals.
- **Lines**:
- RL, SFT, MT, and Base lines are plotted with distinct colors and markers.
- SFT overtakes RL between `k=1` and `k=2`, becoming the highest-performing line by `k=3`.
### Footer
- No footer text or annotations.
## 5. Data Table Reconstruction
| k | RL (%) | SFT (%) | MT (%) | Base (%) |
|----|--------|---------|--------|----------|
| 1 | 4.8 | 4.5 | 1.8 | 1.0 |
| 2 | 7.2 | 8.0 | 2.0 | 1.5 |
| 3 | 9.5 | 11.0 | 2.5 | 2.5 |
## 6. Observations
- **Performance Trends**:
- SFT demonstrates the steepest growth, surpassing RL by `k=2` and reaching ~11% at `k=3`.
- RL maintains a consistent upward trajectory but grows slower than SFT.
- MT and Base lines remain the lowest performers, with minimal improvement across `k`.
- **Cross-Validation**:
- All data points align with their respective legend colors and markers.
- Y-axis increments (2.5%) match gridline spacing, ensuring accurate trend interpretation.
## 7. Conclusion
The chart illustrates performance metrics (Pass@k %) for four algorithms (RL, SFT, MT, Base) across increasing values of `k`. SFT outperforms all others by `k=3`, while MT and Base show negligible improvement. RL remains a strong performer but is overtaken by SFT at intermediate `k` values.