## Circular Flowchart: Mathematical Concept Hierarchy
### Overview
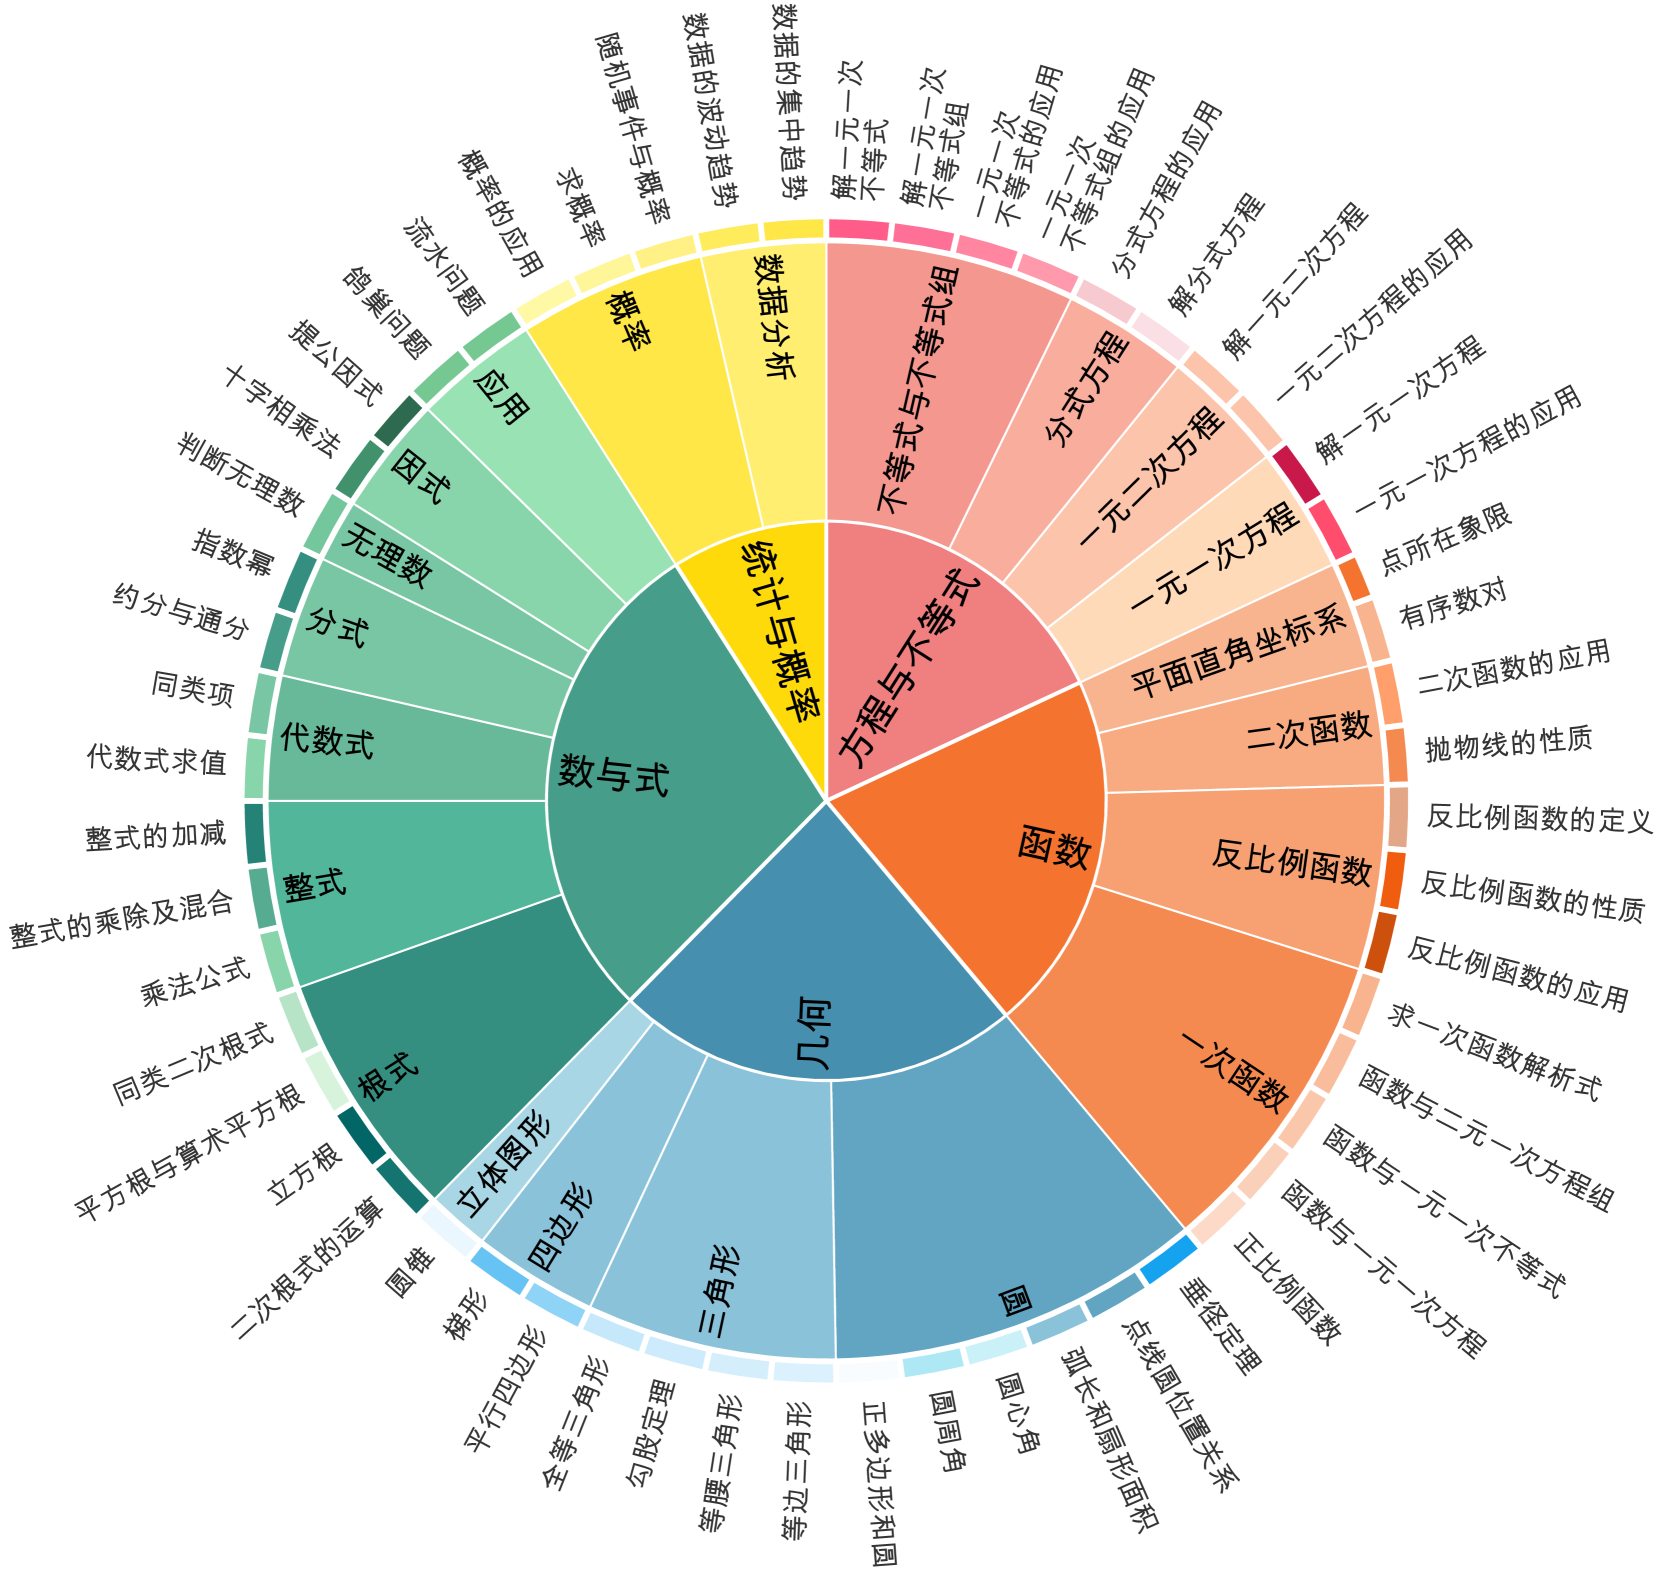
The diagram presents a color-coded circular flowchart organizing mathematical concepts into four hierarchical categories: 数与式 (Numbers and Formulas), 几何 (Geometry), 函数 (Functions), and 方程与不等式 (Equations and Inequalities). Each category branches into subcategories with distinct color-coding and spatial arrangement.
### Components/Axes
**Legend** (Right Side):
- **红色 (Red)**: 数与式 (Numbers and Formulas)
- **黄色 (Yellow)**: 几何 (Geometry)
- **橙色 (Orange)**: 函数 (Functions)
- **蓝色 (Blue)**: 方程与不等式 (Equations and Inequalities)
- Additional colors (pink, purple, teal, green) used for subcategories
**Main Circle**:
- Divided into four quadrants corresponding to the legend colors
- Subcategories arranged radially outward from each quadrant
### Detailed Analysis
**1. 数与式 (Red Section)**:
- **素数与分解**: Prime numbers and factorization
- **指数与运算**: Exponents and operations
- **同类项与代数式**: Like terms and algebraic expressions
- **代数式求值**: Evaluation of algebraic expressions
- **整式运算**: Polynomial operations
- **乘法公式**: Multiplication formulas
- **同类二次根式**: Like quadratic radicals
- **平方根与算术平方根**: Square roots and arithmetic square roots
**2. 几何 (Yellow Section)**:
- **立体图形**: Solid geometry
- **立方根**: Cube roots
- **圆锥与圆柱**: Cones and cylinders
- **平行四边形**: Parallelograms
- **圆周角定理**: Circle angle theorem
- **圆内接四边形**: Cyclic quadrilaterals
**3. 函数 (Orange Section)**:
- **一次函数**: Linear functions
- **一次函数图像**: Graphs of linear functions
- **二次函数**: Quadratic functions
- **二次函数图像**: Graphs of quadratic functions
- **函数比值**: Function ratios
- **反比例函数**: Inverse variation functions
**4. 方程与不等式 (Blue Section)**:
- **整式方程**: Polynomial equations
- **一次方程**: Linear equations
- **一次方程组**: Systems of linear equations
- **二次方程**: Quadratic equations
- **一次不等式**: Linear inequalities
- **绝对值方程**: Absolute value equations
- **点线圆位置关系**: Point-line-circle relationships
**Color-Coding Scheme**:
- Red: Core algebraic concepts
- Yellow: Geometric shapes and theorems
- Orange: Function types and properties
- Blue: Equation solving and inequalities
- Secondary colors: Sub-concepts and formulas
### Key Observations
1. Hierarchical Structure: Top-level categories (red/yellow/orange/blue) form the foundation, with subcategories radiating outward.
2. Spatial Relationships: Related subcategories cluster near their parent category (e.g., linear/quadratic functions near the orange section).
3. Color Progression: Secondary colors transition from light to dark within each category (e.g., light pink for basic formulas, darker purple for advanced concepts).
4. Balanced Distribution: Each main category contains 5-7 subcategories, maintaining visual equilibrium.
### Interpretation
The diagram appears to represent an educational framework for mathematics, emphasizing:
- Conceptual grouping through color-coding
- Logical progression from basic to advanced topics
- Spatial memory aids through radial organization
- Visual hierarchy between main categories and subcategories
The use of distinct color zones helps differentiate broad mathematical domains while maintaining connections through the circular layout. This structure suggests an intentional design for cognitive mapping of mathematical relationships, particularly effective for visual learners.