## Diagram: Grid-Based Workflow or Process Flow
### Overview
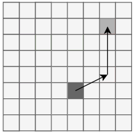
The image depicts a 10x10 grid with two colored squares (dark gray and light gray) and two directional arrows. The arrows form a path from the dark gray square to the light gray square, suggesting a sequential process or relationship between the two elements. No textual labels, legends, or numerical data are present.
### Components/Axes
- **Grid**: A 10x10 matrix of cells, with no labeled axes or scales.
- **Arrows**:
- A vertical arrow pointing upward from the dark gray square.
- A diagonal arrow pointing from the end of the vertical arrow to the light gray square.
- **Squares**:
- **Dark Gray Square**: Positioned at grid coordinates (5,5) (assuming top-left origin).
- **Light Gray Square**: Positioned at grid coordinates (8,8).
### Detailed Analysis
- **Grid Structure**: The grid is uniform, with no shading or annotations to differentiate cells.
- **Arrow Path**:
- The vertical arrow spans 3 grid units (from row 5 to row 8).
- The diagonal arrow spans 3 grid units horizontally (from column 5 to column 8) and 3 grid units vertically (from row 8 to row 11, though the grid only extends to row 10, suggesting a possible truncation or error in the diagram).
- **Color Coding**: The dark gray square may represent a starting point, while the light gray square could indicate a destination or final state.
### Key Observations
1. The arrows create a clear directional flow from the dark gray square to the light gray square.
2. The vertical arrow’s endpoint (row 8) does not align perfectly with the diagonal arrow’s starting point (row 8, column 5), creating a slight discontinuity.
3. The grid’s boundaries may be incomplete, as the diagonal arrow extends beyond the visible grid (row 11).
### Interpretation
The diagram likely represents a simplified workflow, process, or relationship between two entities (dark gray and light gray squares). The arrows suggest a stepwise progression, though the lack of labels or context leaves the exact nature of the relationship ambiguous. The misalignment of the arrow endpoints and the grid’s truncation could indicate an error in the diagram’s design or a deliberate abstraction. Without additional context, the image serves as a generic representation of sequential dependency or transition.
## Notes
- **Language**: No non-English text is present.
- **Data Absence**: The image contains no numerical data, charts, or tables.
- **Assumptions**: Coordinates are estimated based on grid alignment; the grid’s origin (top-left vs. bottom-left) is unspecified.