## Spectrogram and Waveform Analysis: Speech Comparison
### Overview
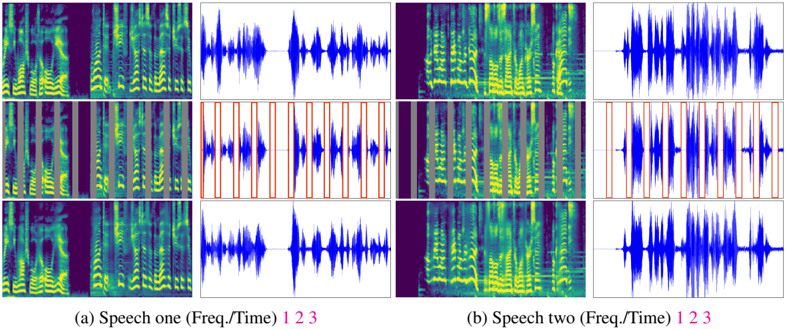
The image presents a comparative analysis of two speech samples (Speech one and Speech two) across three time-frequency segments (1, 2, 3). Each segment includes a spectrogram (left) and corresponding waveform (right), with annotations highlighting specific features.
---
### Components/Axes
1. **Spectrogram Axes**:
- **X-axis**: Time (s) - Linear scale from 0 to ~3 seconds.
- **Y-axis**: Frequency (Hz) - Logarithmic scale from ~0 to ~4 kHz.
- **Color Scale**: Intensity (dB) - Dark blue (low) to bright yellow (high).
2. **Waveform Axes**:
- **X-axis**: Time (s) - Linear scale matching spectrogram.
- **Y-axis**: Amplitude (normalized) - Vertical displacement of audio signal.
3. **Annotations**:
- **Red Boxes**: Highlighted intervals in Speech two, Subsection 2 (Time: ~0.5–1.5s).
- **Subsection Labels**: "1", "2", "3" in magenta, positioned at bottom-left of spectrograms.
4. **Legend**:
- **Top-right corner**:
- Blue: Waveform (Speech one/two).
- Green/Yellow: Spectrogram intensity.
---
### Detailed Analysis
#### Speech one
- **Subsection 1**:
- Spectrogram: Dominant vertical stripes at ~1–2 kHz, indicating sustained vowel sounds.
- Waveform: Moderate amplitude peaks (~0.5–1.0) with consistent periodicity.
- **Subsection 2**:
- Spectrogram: Reduced intensity at ~500 Hz, suggesting transitional phonemes.
- Waveform: Lower amplitude (~0.2–0.4) with irregular oscillations.
- **Subsection 3**:
- Spectrogram: Broadband noise (0.5–4 kHz) with intermittent peaks, likely fricatives or background noise.
- Waveform: High-amplitude bursts (~1.2–1.8) with chaotic patterns.
#### Speech two
- **Subsection 1**:
- Spectrogram: Similar vertical stripes to Speech one but narrower bandwidth (~1.5–2.5 kHz).
- Waveform: Slightly higher amplitude (~0.6–1.1) with sharper peaks.
- **Subsection 2** (Highlighted):
- Spectrogram: Red boxes mark intervals with abrupt frequency drops (~200 Hz) and intensity spikes (~3 kHz).
- Waveform: Sharp transients (~0.8–1.2) with irregular spacing.
- **Subsection 3**:
- Spectrogram: More pronounced noise floor (0.3–3 kHz) compared to Speech one.
- Waveform: Lower overall amplitude (~0.3–0.7) with reduced peak sharpness.
---
### Key Observations
1. **Subsection 2 Highlights**:
- Speech two exhibits abrupt spectral changes (red boxes), potentially indicating phonetic boundaries or articulation errors.
- Waveform transients align with spectrogram intensity spikes, suggesting plosive consonants or glottal stops.
2. **Subsection 3 Variability**:
- Speech one shows higher energy in broadband noise, possibly due to environmental interference.
- Speech two’s reduced amplitude may reflect quieter articulation or post-processing.
3. **Temporal Consistency**:
- Both speeches maintain similar temporal alignment (3-second duration), but Speech two’s waveforms display greater amplitude variability.
---
### Interpretation
The data suggests a comparative study of speech characteristics, possibly for phonetic analysis or speaker identification. The highlighted intervals in Speech two (Subsection 2) may represent critical features for distinguishing speech patterns, such as dialectal differences or pathological speech markers. The spectrogram-waveform correlation confirms that spectral features (e.g., formants, noise) directly map to temporal amplitude variations. Subsection 3’s noise differences could indicate varying recording conditions or speaker-specific prosody. The use of color coding enhances interpretability by decoupling time-frequency intensity from amplitude visualization.