\n
## Diagram: Step-by-Step Solution to a Percentage Word Problem
### Overview
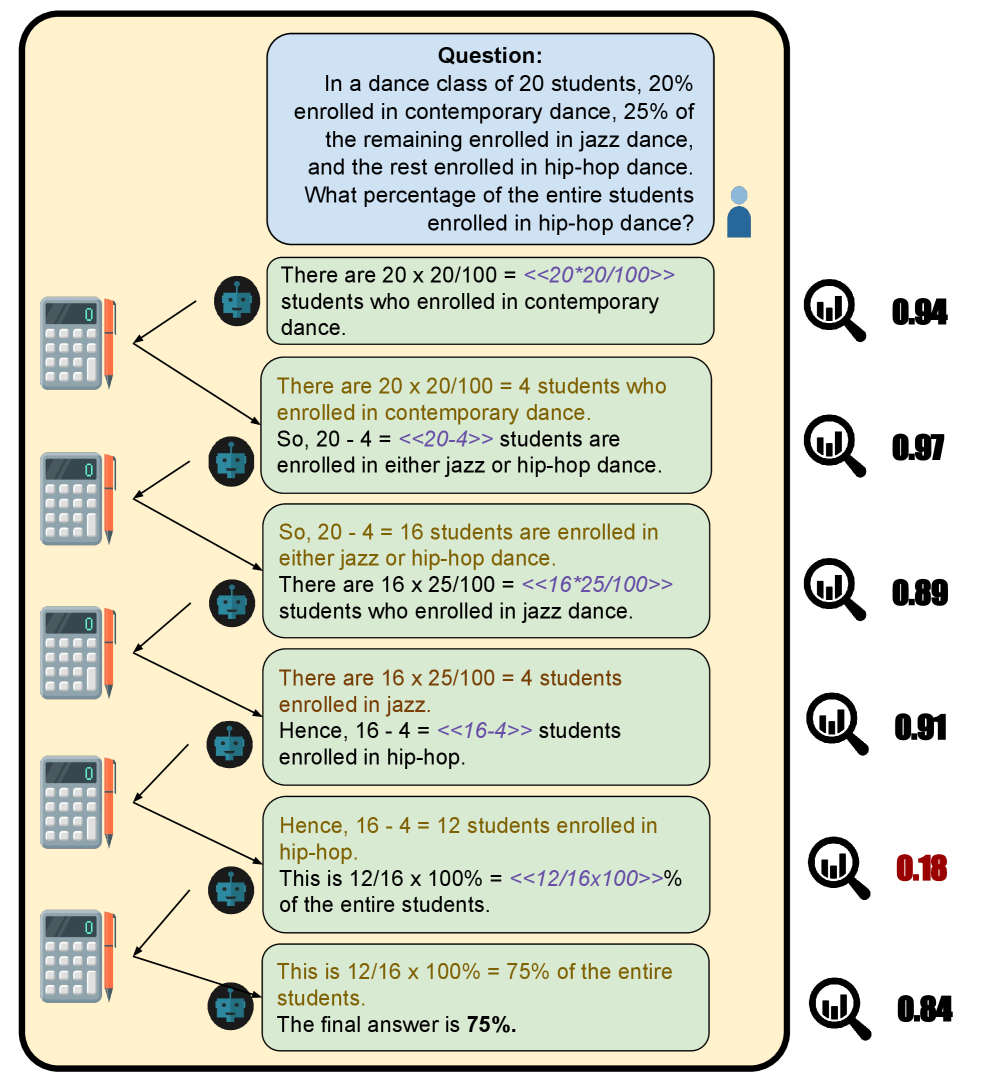
The image is a flowchart-style diagram illustrating a step-by-step mathematical solution to a word problem about student enrollment in dance classes. It includes the problem statement, a sequence of calculations with intermediate results, and a final answer. On the right side, there is a column of numerical scores (likely confidence or accuracy metrics) associated with each step.
### Components/Axes
1. **Problem Statement (Top, Blue Box):**
* **Text:** "Question: In a dance class of 20 students, 20% enrolled in contemporary dance, 25% of the remaining enrolled in jazz dance, and the rest enrolled in hip-hop dance. What percentage of the entire students enrolled in hip-hop dance?"
* **Icon:** A small blue person silhouette is to the right of the text.
2. **Solution Steps (Main Column, Beige Background):**
* Six sequential steps are presented in light green rounded rectangles.
* Each step is connected by a downward arrow.
* Each step is accompanied by a robot head icon (left) and a calculator icon (far left).
* The text within the steps includes both the reasoning and the mathematical operations, with some calculations highlighted in purple within `<< >>` brackets.
3. **Confidence Scores (Right Column):**
* Six magnifying glass icons, each containing a small bar chart symbol.
* Next to each icon is a numerical score, aligned horizontally with the corresponding solution step.
* The scores are: **0.94, 0.97, 0.89, 0.91, 0.18, 0.84**.
### Detailed Analysis / Content Details
**Step-by-Step Transcription and Logic:**
* **Step 1:** "There are 20 x 20/100 = <<20*20/100>> students who enrolled in contemporary dance."
* *Calculation:* 20 * 0.20 = 4 students.
* *Confidence Score:* 0.94
* **Step 2:** "There are 20 x 20/100 = 4 students who enrolled in contemporary dance. So, 20 - 4 = <<20-4>> students are enrolled in either jazz or hip-hop dance."
* *Calculation:* 20 - 4 = 16 students.
* *Confidence Score:* 0.97
* **Step 3:** "So, 20 - 4 = 16 students are enrolled in either jazz or hip-hop dance. There are 16 x 25/100 = <<16*25/100>> students who enrolled in jazz dance."
* *Calculation:* 16 * 0.25 = 4 students.
* *Confidence Score:* 0.89
* **Step 4:** "There are 16 x 25/100 = 4 students enrolled in jazz. Hence, 16 - 4 = <<16-4>> students enrolled in hip-hop."
* *Calculation:* 16 - 4 = 12 students.
* *Confidence Score:* 0.91
* **Step 5:** "Hence, 16 - 4 = 12 students enrolled in hip-hop. This is 12/16 x 100% = <<12/16x100>>% of the entire students."
* *Critical Analysis:* This step contains a **logical error**. The fraction `12/16` represents the percentage of the *remaining* students (after contemporary) who chose hip-hop, not the percentage of the *entire* class. The phrase "of the entire students" is incorrect here.
* *Confidence Score:* **0.18** (This is the lowest score, correctly flagging this step as problematic).
* **Step 6:** "This is 12/16 x 100% = 75% of the entire students. The final answer is 75%."
* *Final Answer Given:* 75%.
* *Correct Calculation:* The percentage of the *entire* class (20 students) enrolled in hip-hop is (12 / 20) * 100% = **60%**.
* *Confidence Score:* 0.84
### Key Observations
1. **Procedural Error:** The solution correctly calculates the number of students in each category (4 contemporary, 4 jazz, 12 hip-hop) but makes a critical error in the final percentage calculation. It uses the denominator 16 (the subset of students not in contemporary) instead of 20 (the total class size).
2. **Confidence Score Anomaly:** The confidence score for Step 5 is **0.18**, which is drastically lower than all others (which range from 0.84 to 0.97). This strongly suggests an automated system has identified this specific step as having low reliability or containing an error.
3. **Visual Flow:** The diagram uses a clear top-down flow with icons to denote reasoning (robot) and calculation (calculator). The right-hand column of scores provides a parallel meta-analysis of each step's validity.
### Interpretation
This image appears to be a visualization from an AI or automated tutoring system that not only solves a problem but also self-evaluates its own reasoning process. The data suggests:
* **The system can perform multi-step arithmetic correctly** (Steps 1-4 have high confidence scores).
* **The system has a mechanism for error detection.** The plummeting confidence score at Step 5 indicates the system's internal logic or a separate validator has flagged a discrepancy between the step's conclusion ("of the entire students") and the correct mathematical relationship.
* **The final answer (75%) is incorrect based on the problem statement.** The correct answer is 60%. The diagram thus serves as a case study in how a reasoning error in the final interpretation step can corrupt an otherwise correct procedural solution.
* **The presence of the confidence scores is the most significant informational element.** It transforms the image from a simple wrong solution into a diagnostic tool showing *where* and *with what certainty* the reasoning process broke down. The low score on Step 5 is a direct, quantitative indicator of the precise point of failure.