## Chart: Training Performance Metrics
### Overview
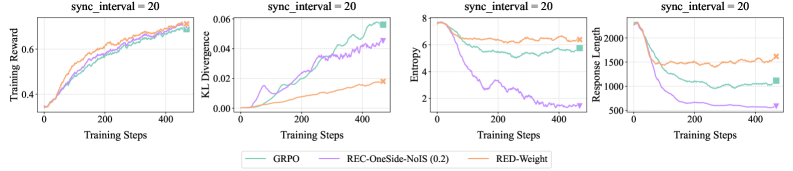
The image presents four line charts displaying training performance metrics over training steps, all with a `sync_interval` of 20. The metrics are Training Reward, KL Divergence, Entropy, and Response Length. Each chart plots the performance of three different methods: GRPO, REC-OneSide-NoIS (0.2), and RED-Weight.
### Components/Axes
* **X-axis (all charts):** Training Steps, ranging from 0 to approximately 450-500.
* **Y-axis (Chart 1):** Training Reward, ranging from 0 to approximately 8.
* **Y-axis (Chart 2):** KL Divergence, ranging from 0 to approximately 0.06.
* **Y-axis (Chart 3):** Entropy, ranging from 0 to approximately 8.
* **Y-axis (Chart 4):** Response Length, ranging from approximately 500 to 2000.
* **Legend (bottom-center):**
* GRPO (Green)
* REC-OneSide-NoIS (0.2) (Purple)
* RED-Weight (Orange)
* **Title (top of each chart):** `sync_interval = 20`
### Detailed Analysis or Content Details
**Chart 1: Training Reward**
* **GRPO (Green):** Line slopes upward, starting at approximately 0 at step 0, reaching approximately 7.5 at step 450.
* **REC-OneSide-NoIS (0.2) (Purple):** Line slopes upward, starting at approximately 0 at step 0, reaching approximately 6.5 at step 450.
* **RED-Weight (Orange):** Line slopes upward, starting at approximately 0 at step 0, reaching approximately 7.0 at step 450.
**Chart 2: KL Divergence**
* **GRPO (Green):** Line slopes upward, starting at approximately 0.01 at step 0, reaching approximately 0.05 at step 450.
* **REC-OneSide-NoIS (0.2) (Purple):** Line slopes upward, starting at approximately 0.02 at step 0, reaching approximately 0.04 at step 450.
* **RED-Weight (Orange):** Line slopes upward, starting at approximately 0.005 at step 0, reaching approximately 0.03 at step 450.
**Chart 3: Entropy**
* **GRPO (Green):** Line initially decreases from approximately 7.5 at step 0 to approximately 2.5 at step 100, then fluctuates around 2.5 to 3.5 until step 450.
* **REC-OneSide-NoIS (0.2) (Purple):** Line slopes downward, starting at approximately 6 at step 0, reaching approximately 1.5 at step 450.
* **RED-Weight (Orange):** Line initially decreases from approximately 7.5 at step 0 to approximately 2.5 at step 100, then fluctuates around 2.5 to 3.5 until step 450.
**Chart 4: Response Length**
* **GRPO (Green):** Line slopes downward, starting at approximately 1800 at step 0, reaching approximately 1000 at step 450.
* **REC-OneSide-NoIS (0.2) (Purple):** Line slopes downward, starting at approximately 1700 at step 0, reaching approximately 700 at step 450.
* **RED-Weight (Orange):** Line slopes downward, starting at approximately 1900 at step 0, reaching approximately 1200 at step 450.
### Key Observations
* All three methods show increasing Training Reward over time.
* KL Divergence increases for all methods, indicating increasing difference between the learned distribution and the prior.
* Entropy decreases for all methods, suggesting the model is becoming more confident in its predictions.
* Response Length decreases for all methods, indicating the model is generating shorter responses.
* The GRPO and RED-Weight methods exhibit similar behavior in Training Reward and Entropy.
* REC-OneSide-NoIS (0.2) consistently has the lowest Response Length.
### Interpretation
The charts demonstrate the training dynamics of three different methods. The increasing Training Reward suggests that all methods are learning to improve their performance. The increasing KL Divergence indicates that the models are diverging from the prior distribution, which could be a sign of overfitting or learning a more specialized distribution. The decreasing Entropy suggests that the models are becoming more certain in their predictions, which is generally desirable. The decreasing Response Length suggests that the models are learning to generate more concise responses.
The similarities between GRPO and RED-Weight suggest that they may be based on similar principles or have similar inductive biases. The consistently shorter Response Length of REC-OneSide-NoIS (0.2) could be due to its specific regularization or training objective. The `sync_interval = 20` parameter likely controls the frequency of synchronization between different components of the training process, and its value of 20 appears to be suitable for all three methods. Further analysis would be needed to determine the optimal value for this parameter.